Tag: parking occupancy

  • How to Measure Parking Use in a Car Park Accumulation Study

    How to Measure Parking Use in a Car Park Accumulation Study

    A single peak occupancy figure can hide how parking demand changes through the day. A car park accumulation study counts vehicles parked within a defined area at set times, showing how occupancy rises and falls. To understand what a car park accumulation study is, focus on the sequence of counts, not just the busiest moment: consistent observations create a picture of parking use over time.

    The count itself is straightforward, but useful findings depend on choosing a study boundary and observation period that reflect how the site operates. The interval between observations also matters because it determines how much detail the results show. Clear tables and diagrams make the method easier to follow and the patterns easier to interpret.

    This guide explains how to choose the study area and period, set survey intervals, calculate accumulation from recorded counts, and present the results in tables and diagrams. It also shows how to make the findings clear, so readers can see how parking use changes across the survey period.

    Key Takeaways

    • Define the car park boundary and the question the survey needs to answer before planning observations.
    • Choose a survey period that captures the parking activity relevant to the site, then use consistent observation intervals.
    • Present counts in an accumulation table and diagram so changes in occupancy are clear across the survey period.
    • Calculate accumulation from the vehicles recorded at each observation, keeping the counting method consistent throughout.
    • Use a professionally delivered Parking Survey when reliable parking-use data is needed to support transport planning.

    Survey timing and observation intervals

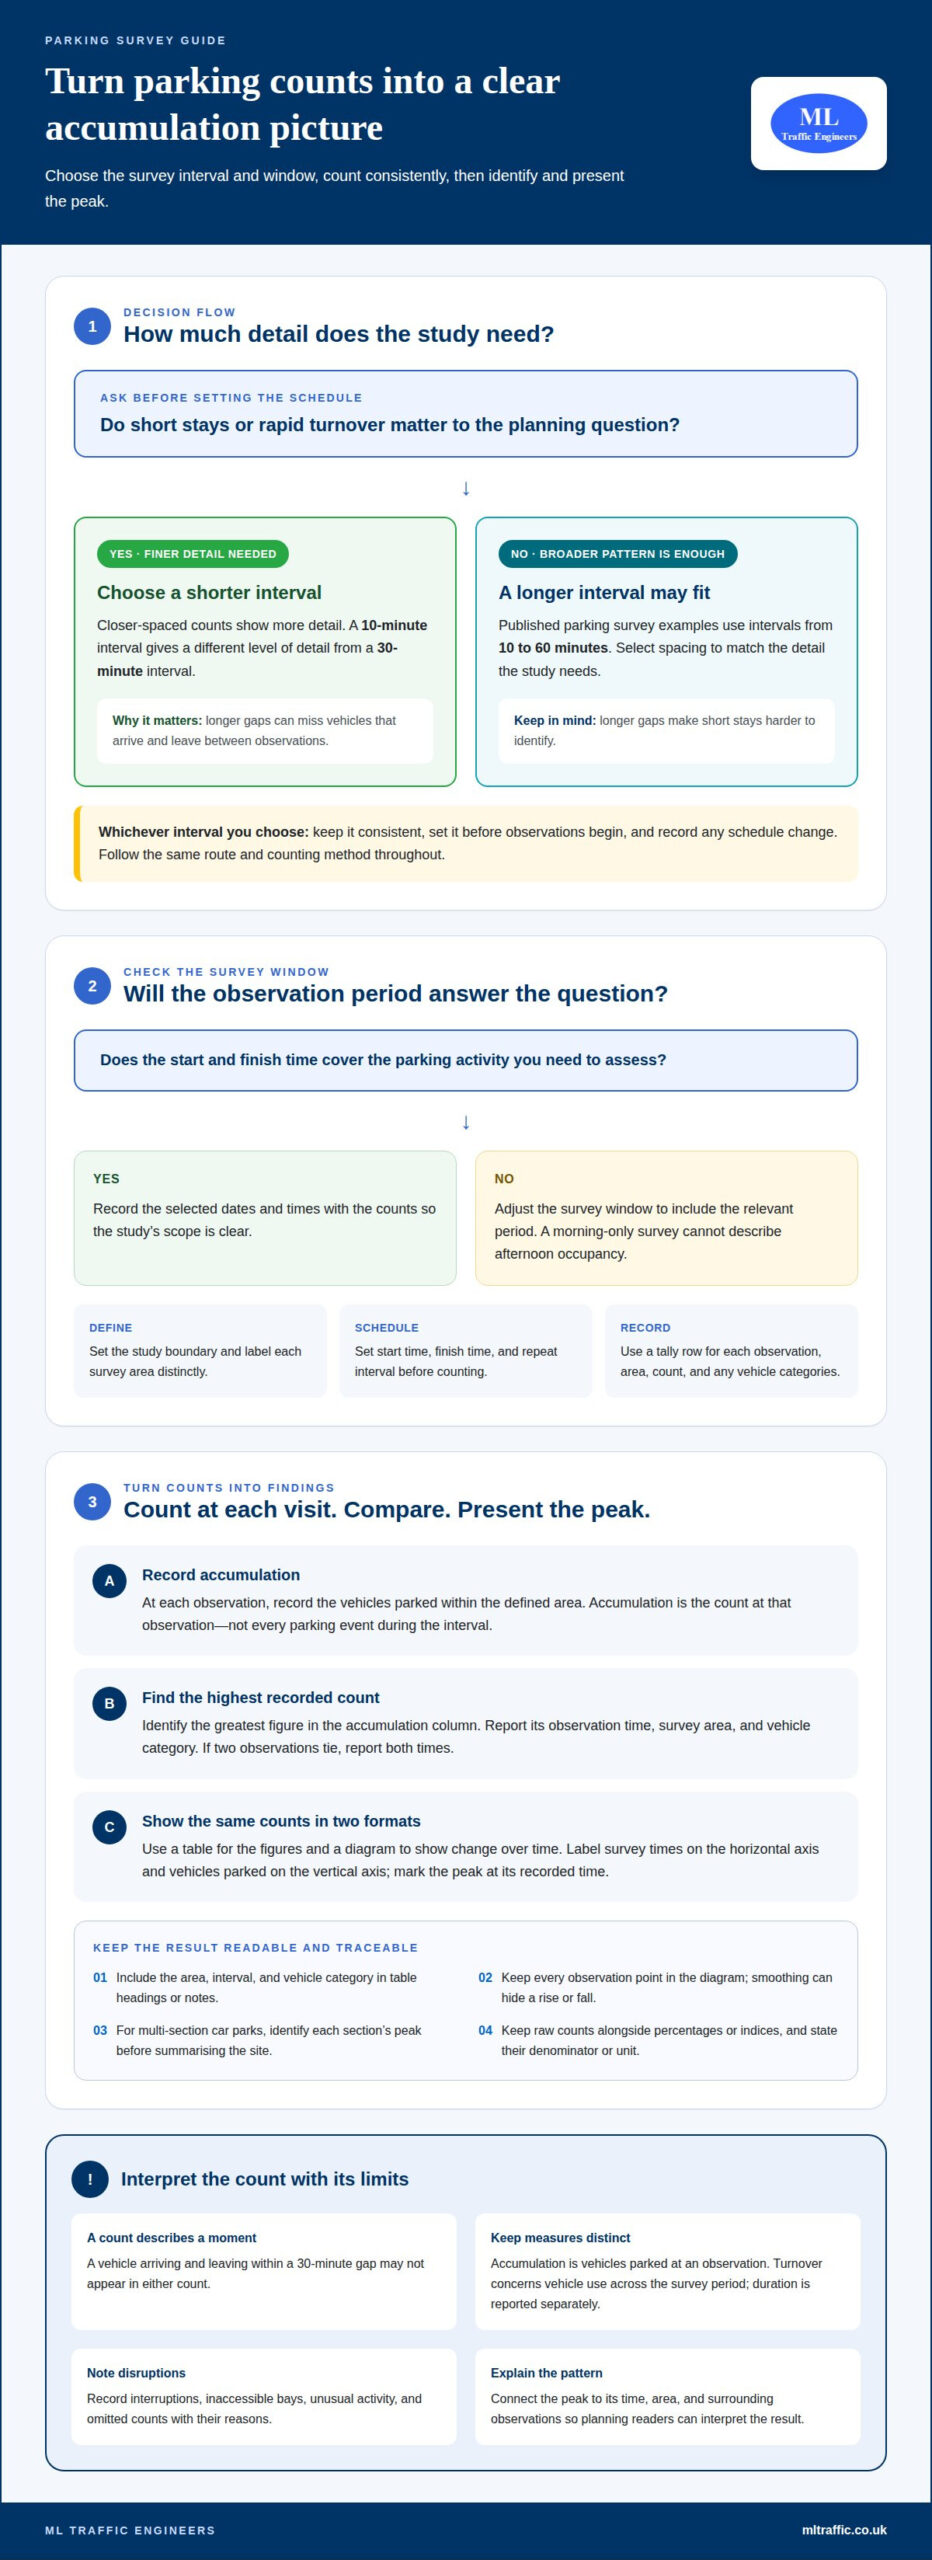
    Plan the observation period around the parking activity being assessed, then use consistent intervals. Published parking survey examples use monitoring intervals from 10 to 60 minutes; the right spacing depends on how much detail the study needs.

    1. Set Observation Times and Intervals

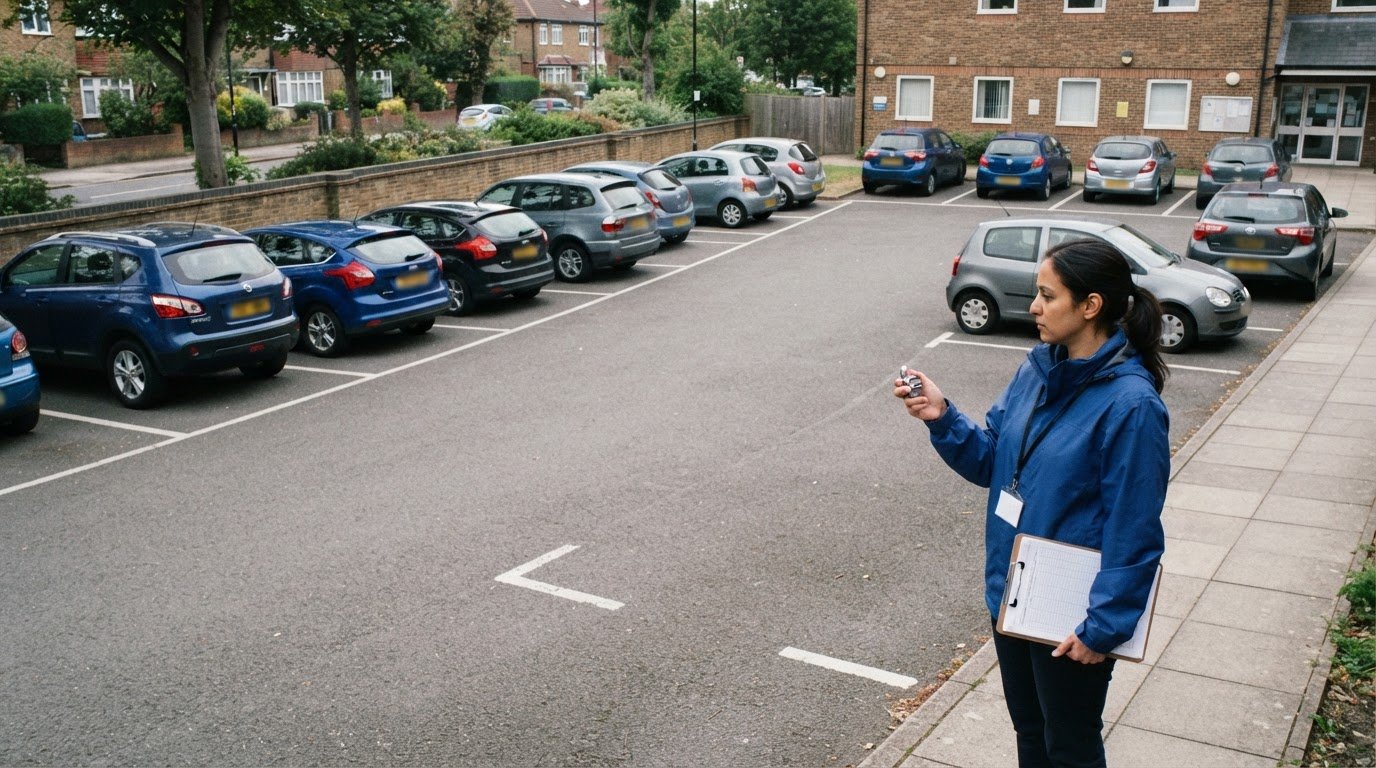
      Set a start time, finish time and repeat interval before observations begin. In the UK, surveyors record the vehicles parked within the defined area at each observation, following the same route and method throughout. A 30-minute interval gives a different level of detail from a 10-minute interval.

      Choose an interval suited to expected turnover and the purpose of the assessment. Longer gaps can miss vehicles that arrive and leave between counts, making short stays harder to identify. Keep the interval consistent, and avoid changing the survey schedule mid-study unless you record the change.

    2. Prepare Accumulation Tally Sheets

      Prepare a tally sheet with one row for each observation time and clear fields for the area, date, count and any vehicle categories being recorded. For example, a 09:00 observation row should be completed before the next scheduled count. Give each survey area a distinct label to prevent counts being assigned to the wrong section.

      Use the same recording terms on every sheet. Leave space for brief notes about access restrictions, unusual activity or a disrupted observation. These notes can explain a count that differs from nearby entries. Check that every scheduled time has a completed count or a recorded reason for an omission.

    3. Match the Survey Window to the Planning Question

      Choose start and finish times that capture the period relevant to the site, such as a busy operating period or a typical working day. A survey covering only the morning cannot describe afternoon occupancy. Record the selected dates and times alongside the counts to make the study’s scope clear.

      For planning applications and Transport Assessments, accumulation results can show how parking demand changes during the observed period. The evidence describes peak occupancy and whether demand remains steady or fluctuates. Interpret it alongside the survey’s defined area, dates and observation intervals.

    4. Record Limitations as They Occur

      Record interruptions, inaccessible bays and other conditions that affect a count, rather than treating every observation as complete. A survey interval can also miss brief stays between visits. For example, a vehicle arriving and leaving within a 30-minute gap may not appear in either count.

      Accumulation counts describe occupancy at observation times, not every parking event. Keep tally sheets and field notes together, and state the interval used when presenting results. This makes the method and its limitations clear to planning readers.

    Accumulation tables and diagrams

    Identify peak parking demand by finding the highest recorded accumulation, then report the observation time and vehicle count. A table shows the figures, while a diagram makes changes across the survey period easier to see.

    1. Calculate Accumulation from Survey Data

      Enter each observation’s recorded vehicles in a table, keeping separate rows for times and, where relevant, vehicle categories. Compare the rows to identify the highest number parked at one time. For example, a 60-minute monitoring example recorded demand of 16 motorised two-wheelers and a unique parked-vehicle percentage of 50%.

      Keep accumulation distinct from turnover and parking duration. Accumulation counts vehicles parked at an observation; turnover concerns vehicle use across the survey period. Report duration separately, rather than presenting it as peak accumulation. This distinction helps planning readers interpret each measure correctly.

    2. Identify Peak Parking Demand

      Find the greatest recorded count in the table’s accumulation column. Record its observation time, survey area and vehicle category so readers can see exactly where the peak occurred. If two observations share the highest count, report both times rather than implying there was only one peak.

      For a multi-section car park, identify the peak in each section before summarising the site. Keep section-level figures visible because a site-wide total can conceal local pressure. If the study also calculates a parking index or percentile, state its unit and explain what the measure describes. Do not present an index as a vehicle count.

    3. Present Results in Tables and Diagrams

      Present observation times and accumulated vehicles in a table, then plot the same counts on a diagram. Label the horizontal axis with survey times and the vertical axis with vehicles parked. Use the same units in both formats, and mark the peak count at its recorded time.

      Include the survey area, observation interval and vehicle category in the table heading or notes. A diagram should retain every observation point; smoothing the line can hide a sudden rise or fall. Add a concise interpretation stating when the peak occurred and how accumulation changed around it.

    4. Make the Findings Useful for Planning

      Keep raw counts alongside any derived percentage or parking index so the calculation remains traceable. State the denominator for each percentage and define the unit used for an index. For example, the percentage of unique parked vehicles is not interchangeable with the number occupying spaces at one observation.

      Use the findings to explain observed parking demand in a planning assessment, rather than presenting a chart without context. A clear account connects the peak, the relevant section and the survey times. This supports interpretation in a Transport Assessment.

    Choosing a study period

    Select dates and times that reflect the parking question being assessed. Land use, seasonal patterns and events can all affect recorded accumulation.

    1. Start with the site’s main activity. Identify whether the car park serves offices, shops, homes, a hospital or a leisure venue. An office site may have a different weekday pattern from a retail car park, while hospital parking can reflect appointments, staff shifts and visiting hours. Choose a period that captures the activity relevant to the assessment, rather than assuming one survey window represents every use.
    2. Consider the season and calendar. School holidays, Christmas shopping and summer visitor activity can change who travels and when parking demand occurs. A survey during a school holiday may not represent a term-time weekday near a school. Record the season and relevant calendar conditions with the results so readers can understand the context of the observed parking pattern.
    3. Identify events that could alter demand. A football match, concert, local market or major appointment day can create parking activity outside a site’s usual pattern. Decide whether the study should capture ordinary conditions or a specific event. If an event overlaps the survey, note its timing and location; otherwise, its peak could be mistaken for typical demand.
    4. Match the survey period to the assessment purpose. For a proposed development near shops, the relevant period may differ from one near offices or a hospital. Set dates and hours that cover the activity the assessment needs to understand, including arrival, stay and departure patterns. A short observation window can omit a later peak, so define what the chosen period can and cannot show.
    5. Record conditions that affect interpretation. Alongside the counts, note the day of the week, seasonal context, known events and unusual site conditions. For example, a road closure near a town-centre car park may change access and parking choices. Keep those details with the survey results, and distinguish an event-related change from the normal pattern the study aims to describe.

    Seasonality, events and land use affect accumulation by changing who visits, when they arrive and how long they stay. Christmas trading, a school holiday or a football fixture can produce a different pattern from an ordinary weekday, so the survey context matters.
    How to Measure Parking Use in a Car Park Accumulation Study

    Selecting a study area

    Draw a clear boundary around the parking spaces included in the survey. That boundary determines which vehicles belong in each count and how the results should be interpreted.

    1. Define the study question first. Decide whether the survey concerns one car park, a development’s parking provision or parking around a destination. For a single site, identify the spaces relevant to the question being assessed. A boundary that includes unrelated parking can distort the total, while one that excludes relevant spaces may understate demand.
    2. Map the area and its access points. Mark the included spaces on a site plan and label each section clearly. Show entrances, exits and internal routes so surveyors can identify the correct area at every observation. If a site separates staff parking from visitor parking, label each area separately instead of combining the counts without distinction.
    3. Distinguish nearby parking from the site. Identify adjacent streets, private car parks and other parking areas before the survey begins. Include them only if they form part of the study question, and record them separately from the main site. For example, a survey of a retail car park should not silently include nearby on-street spaces in its occupancy total.
    4. Choose a boundary that fits the survey route. Confirm that surveyors can consistently observe all included spaces, including separate courts or parking rows. Mark any area that cannot be seen from the same route. A clear plan helps prevent double-counting spaces or missing vehicles as observations move between sections.
    5. Record the site features that define the area. Note the layout, bay arrangement, access restrictions and any physical separation between parking zones. For example, a barrier-controlled section may operate differently from open visitor parking. These details help readers understand which spaces each count represents, without confusing the study area with the wider neighbourhood.
    6. Match labels across the survey records. Use the same section names on the site plan, tally sheets, tables and diagrams. If the car park has separate staff and visitor sections, report both individually before showing any combined total. Consistent labels let readers trace a peak to its location and see whether demand concentrates in one part of the site.

    For a long commercial corridor, define the surveyed section precisely rather than treating the whole road as one undifferentiated area. The surveyed commercial section of Sir Lakhajiraj Road was 2600 metres long. Record where the section begins and ends on the study plan, and make those limits clear to anyone carrying out or reviewing the observations. A defined extent helps keep the count focused on the intended commercial area and makes it easier to distinguish the surveyed section from adjoining parts of the road.

    Where parking is spread along a corridor, use consistent location labels to show where each observation belongs. Mark layout or access changes that help surveyors recognise the boundaries, and follow the same route and recording method throughout the study. Keep parking outside the defined section separate unless it is explicitly part of the survey question. This makes the counts easier to interpret and reduces the risk of including spaces beyond the study limits or overlooking spaces within them.

    How is parking accumulation calculated from survey data?

    Use the recorded number of vehicles parked inside the defined study area at each observation. The highest count is the peak accumulation for that area and survey period.

    1. Confirm the count unit. Decide whether each entry records vehicles, a particular vehicle category or another defined measure. Keep the unit consistent across every observation. For example, a count of motorised two-wheelers must not be combined with car counts unless the results clearly separate the categories.
    2. Enter each observation count. Transfer the tally for each scheduled time into a results table, using the same area label and category. A study’s 60-minute monitoring example recorded parking demand of 16 motorised two-wheelers. This is an accumulation count at the observation, not a count of every vehicle that visited during the hour.
    3. Calculate the accumulation at each time. For each observation, add the vehicles parked within the boundary at that moment. Where the survey separates sections or categories, calculate each subtotal before producing a combined figure. Keep the original tallies alongside calculated totals so readers can trace how each result was derived.
    4. Distinguish accumulation from unique vehicles. Accumulation describes how many vehicles occupy the area at an observation; unique vehicles count distinct vehicles across the survey. A 60-minute example reported 50% as the percentage of unique parked vehicles. Keep that percentage separate from the recorded count of 16 motorised two-wheelers.
    5. Identify the peak count. Compare the accumulation totals across all recorded times, then select the greatest value. State its observation time, area and vehicle category. If the same maximum appears at more than one observation, report each matching time. This prevents the summary from suggesting a single peak when the data show otherwise.
    6. Check the calculation against the survey record. Compare the table with the original tallies and confirm that each observation has the correct time, area and unit. Check that section subtotals match any combined total. A missing count or category mismatch can change the reported peak, so retain notes explaining any incomplete observation.
    7. Report the result with its context. Present the peak alongside the full series of counts, observation interval and study boundary. A maximum without its survey period cannot show how demand changed before or after the peak. For support with recording and interpreting parking-use data, arrange a parking survey.

    Survey timing can shape what an accumulation result captures. The commercial parking survey on Sir Lakhajiraj Road was conducted from 5:10-8:10 pm, while the Chandigarh Sector 17 parking survey recorded vehicles from 9:00 A.M. to 8.30 P.M. These periods provide context for interpreting counts, rather than making observations from different windows directly interchangeable.

    Other survey findings can help explain why observed demand matters, while remaining distinct from accumulation totals. The average parking-space search time estimated from a review of studies in 11 international cities was 8.1 minutes. In a survey on illegal parking, 48% of respondents acknowledged having parked illegally. In a survey of South East London residents, 83% said that having extra living space instead of a garage would detract from their property’s value, and 46% said they would buy a house with more parking provision if they moved at that time. These responses describe search experience, conduct and preferences, not parked-vehicle counts.

    ML Traffic Engineers UK: Parking Surveys

    ML Traffic Engineers UK carries out Parking Surveys to provide measured evidence of parking use for development and planning work. A survey can establish how occupancy changes across a defined area and period, supporting decisions about existing or proposed parking provision. Where the findings form part of a wider planning submission, they can inform a Transport Statement or Transport Assessment.

    Turn to a Parking Survey when a project needs clear, structured data on parking demand rather than an estimate based on a single observation. The survey scope can reflect the site, the planning question and the results required. To discuss your project, contact ML Traffic Engineers UK.

    Put your parking evidence to work

    Understanding what a car park accumulation study can establish is a useful starting point. The next step is deciding how the findings will support the project’s planning case and what other transport evidence may be needed. A clear purpose keeps survey outputs relevant to the decisions ahead.

    ML Traffic Engineers UK provides Parking Surveys, Transport Statements and Swept Path Analysis. These services address different project needs, from gathering evidence of parking use to documenting access and vehicle movement. Choose the support that matches your development and its planning requirements.

    Bring your project’s parking and transport questions into focus. Discuss your next steps with ML Traffic Engineers UK, and move forward with evidence suited to your plans.

    Frequently Asked Questions

    What is a car park accumulation study?

    A car park accumulation study measures how many vehicles occupy a defined parking area at successive observation times. The results show how occupancy changes during the survey, including when demand is highest. For example, a site manager can use the recorded pattern to distinguish a brief busy period from sustained high occupancy. The study describes observed use rather than counting every vehicle that entered and left.

    What data is collected during a car park accumulation survey?

    A survey records the observation time, the number of vehicles parked and the location or section counted. The method may also separate vehicle types and note site conditions that affect interpretation, such as restricted access or temporary closures. For a multi-section car park, identifying each section separately helps show where demand concentrates. These records let readers understand what each count represents and how the survey area was treated.

    How long should a car park accumulation survey last, and when should it be carried out?

    The survey should cover the operating period relevant to the planning or parking question, rather than follow a fixed duration. A workplace assessment may focus on a normal working day, while a leisure site may need observations during its busiest operating period. Choose dates that reflect the conditions the results need to represent, and record unusual events or closures. Survey length and timing depend on site activity and the decisions the evidence must inform.

    Michael Lee

    Article by

    Michael Lee

    Transport planner with over 35 years' experience.

    Disclaimer

    The content on mltraffic.co.uk, including all technical articles, guides, and resources, is provided for general informational and educational purposes only. It is not intended to constitute professional advice in traffic engineering, transportation planning, development approvals, or any other technical or legal field.
    While ML Traffic Engineers makes every reasonable effort to ensure the accuracy, completeness, and timeliness of the information published, we do not provide any warranties or representations (express or implied) regarding its reliability, suitability, or availability for any particular purpose. Any reliance you place on the content is strictly at your own risk.
    In no event shall ML Traffic Engineers, its directors, employees, authors, or affiliates be liable for any direct, indirect, incidental, special, consequential, or punitive damages (including, without limitation, loss of profits, data, or business opportunities) arising out of or in connection with the use of, or inability to use, any information provided on this website.
    The articles and guides on this site are not a substitute for engaging a qualified, professional traffic engineer to assess your specific project requirements. For tailored advice, compliance assessments, or traffic engineering services, please contact a competent professional.
    This disclaimer may be updated from time to time without notice. By accessing or using this website, you agree to be bound by the most current version of this disclaimer.
  • Parking Surveys in Stanmore: What They Measure and When You Need One

    Parking Surveys in Stanmore: What They Measure and When You Need One

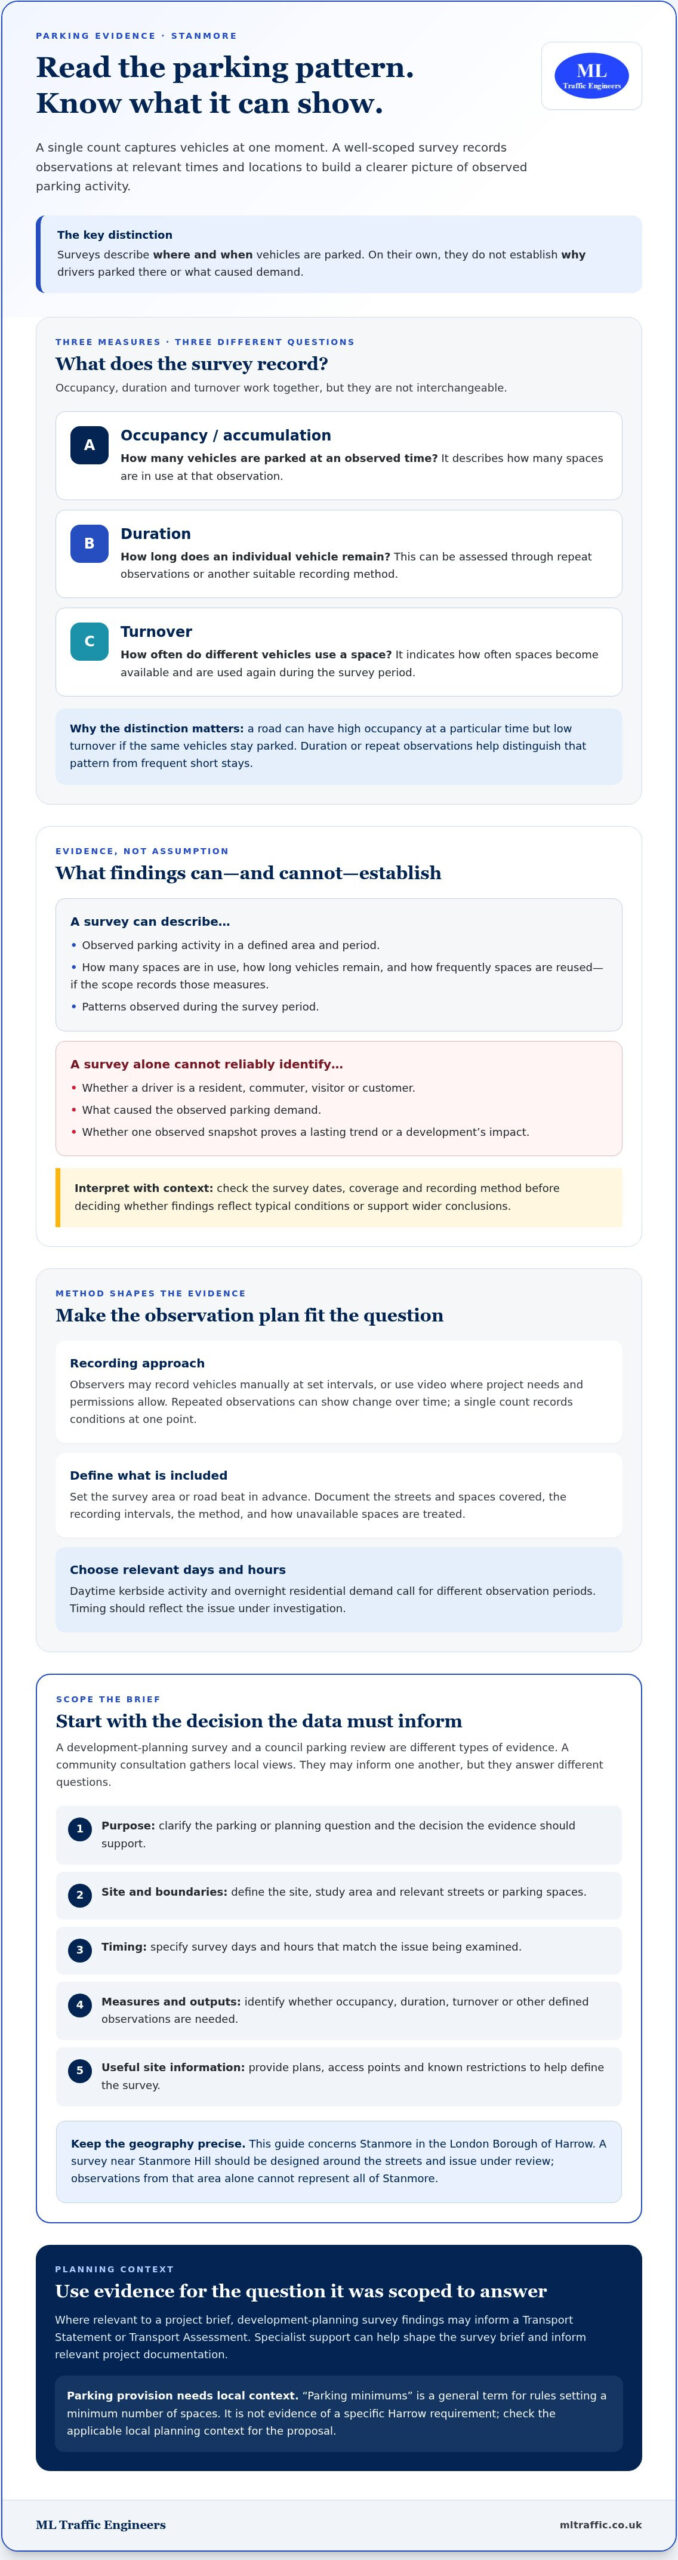
    A busy street in Stanmore may not tell the whole story about local parking pressure. A single count shows how many vehicles are present at one moment, while a well-scoped parking survey stanmore records observations at relevant times and locations to build a clearer picture. The results can reveal recurring patterns during the survey period, but they may not establish whether residents, commuters, visitors or a proposed development caused the observed demand.

    It’s reasonable to ask whether a survey reflects typical conditions or whether it serves the same purpose as a council parking review. These are different types of evidence. A development-planning survey can provide local observations relevant to a particular proposal; a council review may consider wider parking management. The right scope depends on the decision the data needs to inform.

    This article explains what a Stanmore parking survey can measure, how timing and coverage affect its usefulness, and what findings can and can’t establish. It also covers when survey evidence may support a Transport Statement or Transport Assessment, and what information to provide when defining the site, study area, timing and purpose.

    Key Takeaways

    • A parking survey stanmore can help answer a specific planning or parking question. Its usefulness depends on matching the survey scope to that decision.
    • Occupancy, parking duration and turnover describe different aspects of demand. Knowing which measures matter helps you request relevant evidence.
    • Check survey dates, coverage and recording methods before deciding whether findings represent typical conditions or support wider conclusions.
    • When briefing a survey, clarify the decision, site boundaries, study area, timing and required outputs. Provide plans, access points and known restrictions.
    • If a development needs parking evidence considered in a transport-planning context, specialist support can help shape the survey brief and inform relevant project documentation.

    What does a parking survey in Stanmore tell you?

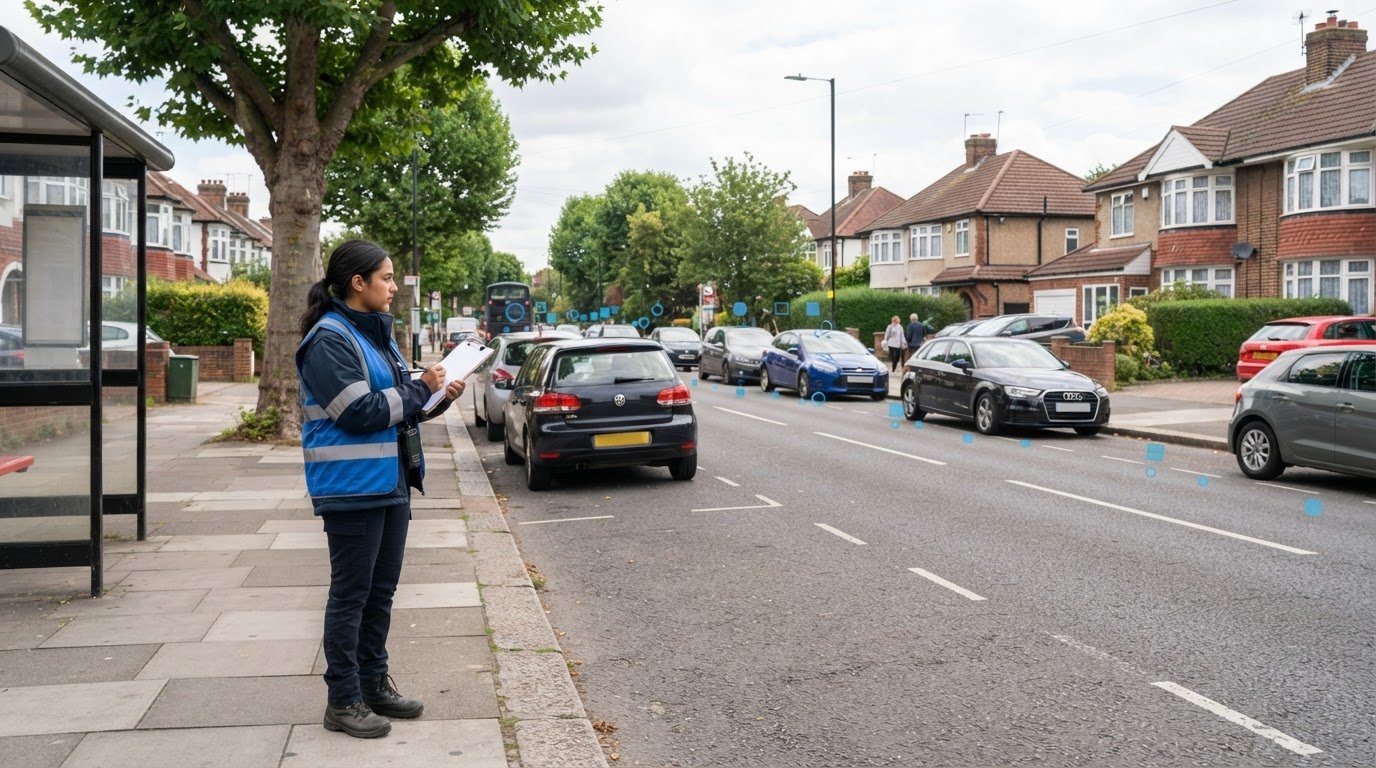
    A parking survey records parked vehicles and kerbside activity in a defined area over a specified period. Depending on the brief, it may record how many spaces are occupied, how long vehicles remain and how often spaces are used by different vehicles. The purpose is to describe observed parking conditions, not to assume why each person parked there.

    This guide refers to Stanmore in the London Borough of Harrow, not other places with the same name. A development-planning survey is commissioned to help assess a particular proposal. Where relevant to the project brief, its findings may inform a Transport Statement or Transport Assessment. A council parking review may consider parking management across an area, while a community consultation gathers local views. These processes may inform one another, but they answer different questions.

    Which Stanmore parking question are you trying to answer?

    First distinguish a concern about existing resident parking from a question about the effect of a proposed development. The first may focus on local parking patterns or kerbside use. The second asks what demand the proposal could add and how that relates to existing conditions around the site.

    That distinction helps determine where and when to observe, and which activity to record. For example, a survey near Stanmore Hill should be designed around the specific streets and issue under review. Observations from that area alone cannot be treated as representative of all Stanmore.

    What a parking survey can, and cannot, establish

    Occupancy describes how many parking spaces are in use at an observed time. Duration tracks how long vehicles stay, while turnover indicates how often spaces are used by different vehicles during the survey period. Together, these measures describe observed parking activity. They don’t reliably identify every driver’s purpose: a parked vehicle alone can’t confirm whether its driver is a resident, commuter, visitor or customer.

    A parking survey records where and when vehicles are parked; it does not, by itself, establish why they are there or what caused the observed demand. Interpret findings in light of the survey dates, coverage and method. A snapshot may show conditions on the day observed, but it shouldn’t automatically be treated as proof of a lasting trend or a development’s impact.

    For development teams, the planning question may include whether proposed parking provision is appropriate. The concept of parking minimums describes rules that set a minimum number of spaces. The link is general background, not evidence of a specific Harrow requirement. Check the applicable local planning context for the proposal before drawing conclusions from survey results.

    How a Stanmore parking survey records occupancy, duration, and turnover

    A survey plan should match the question being investigated. Observers may record parked vehicles manually at set intervals, or use video where the project needs and permissions allow. The method affects what can be captured: repeated observations can show changes over time, while a single count records conditions at one point. Document the approach, recording intervals and treatment of unavailable spaces so the results can be interpreted correctly.

    These measures answer different questions:

    • Occupancy or accumulation: the number of parked vehicles observed at a particular time. This shows how many spaces are in use at that observation.
    • Duration: how long an individual vehicle remains parked, based on repeat observations or another suitable recording method.
    • Turnover: how frequently different vehicles use a parking space during the survey period. It indicates how often spaces become available and are used again.

    For example, a road could have high occupancy at a particular time but low turnover if the same vehicles remain parked. A separate duration or repeat-observation measure is needed to distinguish that pattern from frequent short stays. Occupancy, duration and turnover are related, but they aren’t interchangeable.

    How survey timing and location affect the results

    Survey days and hours should reflect the issue under investigation. A question about daytime kerbside activity calls for a different observation period from one about overnight residential demand. Define the survey area or road beat in advance, including the streets and parking spaces to be included. A limited observation period describes only the conditions recorded. Don’t label it representative of other times or locations without supporting evidence.

    What parking stress and kerbside activity mean

    Parking stress describes pressure on the spaces included in a survey. State exactly how it is measured. For example, an occupancy measure could compare the number of vehicles observed with the number of eligible spaces surveyed at the same time. The result depends on clear rules for defining eligible spaces and recording restrictions or spaces that are temporarily unavailable.

    Kerbside activity can include more than vehicles left in parking spaces. Loading, stopping and restrictions may affect available space or how a location appears during an observation. The survey scope should say whether these activities are recorded and how they are treated, rather than blending them into a parking count without distinction.

    Survey conclusions depend on the defined area, recording method and observation times; they should not be extended beyond the evidence collected. For development proposals, findings may contribute to transport-planning documents where relevant to the project brief. The UK government’s official planning practice guidance provides context on Transport Assessments and Statements. A clearly scoped parking survey and transport-planning service can help connect collected data with the question a project needs to address.

    How to interpret Stanmore parking survey findings without overclaiming

    Begin with the purpose of the evidence. A council-area parking review may examine how parking is managed across a neighbourhood. A resident consultation records views and reported experiences. A development-planning survey collects observations relevant to a particular proposal and its potential parking demand. These sources can inform the same discussion, but they aren’t interchangeable: each has a different scope and answers a different question.

    For a parking survey stanmore, check the survey dates, days and times, the streets or spaces included, and how observations were recorded. A count covering only part of an area may miss pressure elsewhere. A short observation period may capture a particular set of conditions, not a normal pattern. Manual observations and video may capture different details, so understand the method before comparing results.

    Snapshot survey or representative evidence?

    Ask whether the observed days and time periods match the question. If the concern is overnight demand, daytime counts alone won’t answer it. Check for known context that could affect the results, such as an unusual local event or incomplete street coverage. If those details aren’t available, state that limitation rather than assuming the survey reflects typical conditions.

    The Hampshire Chronicle has reported on a three-day parking snapshot in a different Stanmore context, in the Winchester area. That report is not evidence about Stanmore in the London Borough of Harrow. Its location and survey period matter; findings from another place or time shouldn’t be transferred to Harrow or treated as proof of local parking patterns.

    Survey findings versus community consultation

    A survey records observed conditions, such as how many vehicles were parked in a defined area at a particular time. A consultation records what participants say about parking, which can highlight concerns and experiences a count might not explain. Used together, they can give decision-makers different kinds of evidence. Keep them distinct in any summary: don’t present reported views as observed counts or counts as proof of driver identity or trip purpose.

    A sound interpretation separates measured results from assumptions. Present the observations first, then explain what they may suggest and what remains uncertain. For a wider planning context, see this London Transport Assessment guide. It can help frame how transport evidence fits into development documentation, while the project-specific survey scope and local planning context still need to be considered.

    Parking Surveys in Stanmore: What They Measure and When You Need One

    How to scope a parking survey for a Stanmore site

    A useful brief starts with the decision the evidence needs to inform. For a development proposal, that may mean understanding existing parking activity near the site and identifying information that could support a Transport Statement or Transport Assessment. Agree the scope for the specific project rather than assuming a standard survey area, timing or method will suit every Stanmore location.

    What information to provide before data collection

    Give the survey team enough context to define what should be observed and how the results will be used. A clear project brief can follow this sequence:

    1. Define the decision: State the planning or operational question and the evidence you need.
    2. Identify the site: Provide a site plan showing boundaries, proposed access points and relevant development details.
    3. Set the survey area: Mark nearby streets and parking areas to consider, and identify known restrictions or access arrangements.
    4. Agree the time period: Explain which days and times may relate to the question. Confirm the observation schedule for the project rather than assuming one.
    5. Specify the outputs: Clarify the measures, reporting format and limitations that should be documented.

    Include known local concerns where they may help shape the brief. If the issue is suspected resident demand, say so. If the question concerns parking associated with a proposed development, describe the proposal and planning context. These are questions to investigate, not conclusions the survey should assume in advance.

    How survey evidence can support a planning submission

    Parking observations can contribute to a transport-related assessment by describing existing conditions relevant to a proposal. Their value depends on how well the survey area, dates, times and measures match the planning question. Agreeing these details early also helps distinguish what the data can show from what requires wider professional judgement or other project information.

    ML Traffic Engineers UK provides Parking Surveys and prepares Transport Statements and Transport Assessments where relevant to the project brief. A survey may inform those documents, but it doesn’t guarantee a planning outcome or replace assessment of the proposal as a whole. Check requirements against the project’s circumstances and applicable local planning context.

    For broader application context, review the Transport Assessment guide, then consider how a clearly scoped parking survey stanmore could address your project’s evidence needs.

    When to involve a parking survey specialist in Stanmore

    Specialist support may be useful when a development raises a specific parking question, when evidence needs to be coordinated with a planning submission, or when your project team has limited capacity to plan and analyse observations. A defined brief keeps the work focused by linking the survey method and coverage to the decision the project needs to inform.

    Connecting parking data with transport planning

    Parking observations may contribute to a Transport Statement or Transport Assessment by describing conditions relevant to a proposal. The appropriate document and supporting evidence depend on the development and its planning context. A survey can inform that assessment, but it doesn’t determine the planning outcome or replace professional judgement.

    ML Traffic Engineers provides Parking Surveys and transport-planning analysis, and prepares Transport Statements and Transport Assessments where relevant to the project brief. Its work supports projects across Greater London, Manchester, Birmingham, the West Midlands, Liverpool, Surrey, East Sussex, West Sussex, Hampshire, Berkshire and Buckinghamshire. You can review its transport planning services to understand how these services relate to a project. For a parking survey stanmore, confirm project-specific evidence requirements with the relevant planning team rather than assuming a particular scope will apply.

    What to ask a survey provider before starting

    Before commissioning a survey, ask how the proposed scope addresses your project’s specific question. A clear discussion should cover what will be observed, why the selected area and timing are suitable, and how results will be presented. It should also explain the limits of the data, so findings aren’t mistaken for conclusions the observations cannot support.

    • Which streets and parking areas are included, and how were the boundaries chosen?
    • What observation periods and recording method are proposed, and how do they relate to the planning question?
    • How will observed counts be distinguished from assumptions about driver identity or trip purpose?
    • What assumptions, gaps in coverage and limitations will the report state?
    • How could the results fit the project’s Transport Statement or Transport Assessment, if one is relevant?

    These questions help establish a transparent scope before data collection begins. If your Stanmore project needs parking evidence analysed in a transport-planning context, contact ML Traffic Engineers to discuss your survey requirements and project context. Share the site information and planning question so the discussion can focus on the evidence your project may need.

    Make your next parking decision evidence-led

    A useful parking survey stanmore begins with a clear question and a scope designed around the site, relevant streets and observation period. Occupancy, duration and turnover reveal different aspects of parking activity, but results describe only the conditions recorded. They don’t, on their own, identify why drivers parked or prove what caused local demand.

    For development work, well-scoped survey evidence may support a Transport Statement or Transport Assessment where relevant to the project brief. Clear reporting distinguishes observed data from assumptions and shows decision-makers how to interpret the findings.

    ML Traffic Engineers provides Parking Surveys and prepares Transport Statements and Transport Assessments. If you’re assessing a Stanmore site, share the planning question, site information and evidence requirements to start a focused discussion. Discuss your parking survey requirements with ML Traffic Engineers and consider how the data could fit your wider project documentation.

    With a clear question and transparent scope, you can make informed next steps with greater confidence.

    Frequently Asked Questions

    What does a parking survey in Stanmore measure?

    A parking survey records vehicles parked in a defined area and may measure occupancy, duration, turnover and kerbside activity. Occupancy is the number of vehicles observed at a particular time; duration records how long vehicles stay, while turnover tracks how often spaces are used by different vehicles. The measures selected depend on the project question. A survey describes observed conditions during its study period, but doesn’t automatically explain why drivers parked there.

    How long does a parking survey need to run?

    There’s no single duration that suits every parking survey. The observation schedule should reflect the question, location and evidence needed, including relevant days and times. A survey intended to assess overnight parking may need a different schedule from one examining daytime activity. Agree the dates, observation periods and coverage for the specific project, and record any limitations. Don’t treat a brief snapshot as evidence of typical conditions unless its scope supports that conclusion.

    Can a parking survey show whether commuters cause parking problems?

    A parking survey can show patterns such as when spaces are occupied and how long vehicles remain, but observations alone can’t reliably identify every driver’s purpose. A vehicle parked during working hours might belong to a commuter, resident, visitor or someone making a local trip. The report should present observed data separately from assumptions about driver identity. If identifying trip purpose is central to the question, discuss what additional evidence may be suitable for the project.

    What is the difference between a parking survey and a parking consultation?

    A parking survey records observed conditions, such as the number of parked vehicles in a defined area at set times. A consultation gathers people’s views and reported experiences, which may reveal concerns that counts don’t explain. Both can inform a parking discussion, but they aren’t equivalent evidence. Keep measured results distinct from consultation responses, and consider each in light of its method, scope and purpose.

    Is Stanmore Hill covered by the London Borough of Harrow parking review?

    Harrow Council material identifies a parking review and consultation concerning the Stanmore Hill area. That reference doesn’t establish that every nearby road is included, or confirm the review’s current status or boundaries. Check the latest council information for the precise area and any published updates before relying on it. A council review also has a different purpose from a separately scoped development-planning survey for a particular site.

    When might a development need a parking survey for planning?

    A parking survey may be relevant when a development proposal raises questions about existing parking conditions or the effect of additional demand, including where on-site parking is limited. Whether evidence is requested depends on the proposal and planning context, so check current requirements with the relevant planning authority rather than assuming a survey is always necessary. A clearly scoped parking survey stanmore may inform a Transport Statement or Transport Assessment where relevant to the project brief.

    How are parking survey results presented?

    Results may be reported as tables or written analysis showing observed occupancy, duration, turnover and the area and periods covered. The format should make clear how observations were collected, what assumptions were applied and where coverage was limited. Depending on the project brief, findings may also be interpreted in transport-planning documentation. Ask the survey provider which outputs are proposed and how the report will distinguish recorded conditions from conclusions or assumptions.

    Michael Lee

    Article by

    Michael Lee

    Transport planner with over 35 years' experience.

    Disclaimer

    The content on mltraffic.co.uk, including all technical articles, guides, and resources, is provided for general informational and educational purposes only. It is not intended to constitute professional advice in traffic engineering, transportation planning, development approvals, or any other technical or legal field.
    While ML Traffic Engineers makes every reasonable effort to ensure the accuracy, completeness, and timeliness of the information published, we do not provide any warranties or representations (express or implied) regarding its reliability, suitability, or availability for any particular purpose. Any reliance you place on the content is strictly at your own risk.
    In no event shall ML Traffic Engineers, its directors, employees, authors, or affiliates be liable for any direct, indirect, incidental, special, consequential, or punitive damages (including, without limitation, loss of profits, data, or business opportunities) arising out of or in connection with the use of, or inability to use, any information provided on this website.
    The articles and guides on this site are not a substitute for engaging a qualified, professional traffic engineer to assess your specific project requirements. For tailored advice, compliance assessments, or traffic engineering services, please contact a competent professional.
    This disclaimer may be updated from time to time without notice. By accessing or using this website, you agree to be bound by the most current version of this disclaimer.