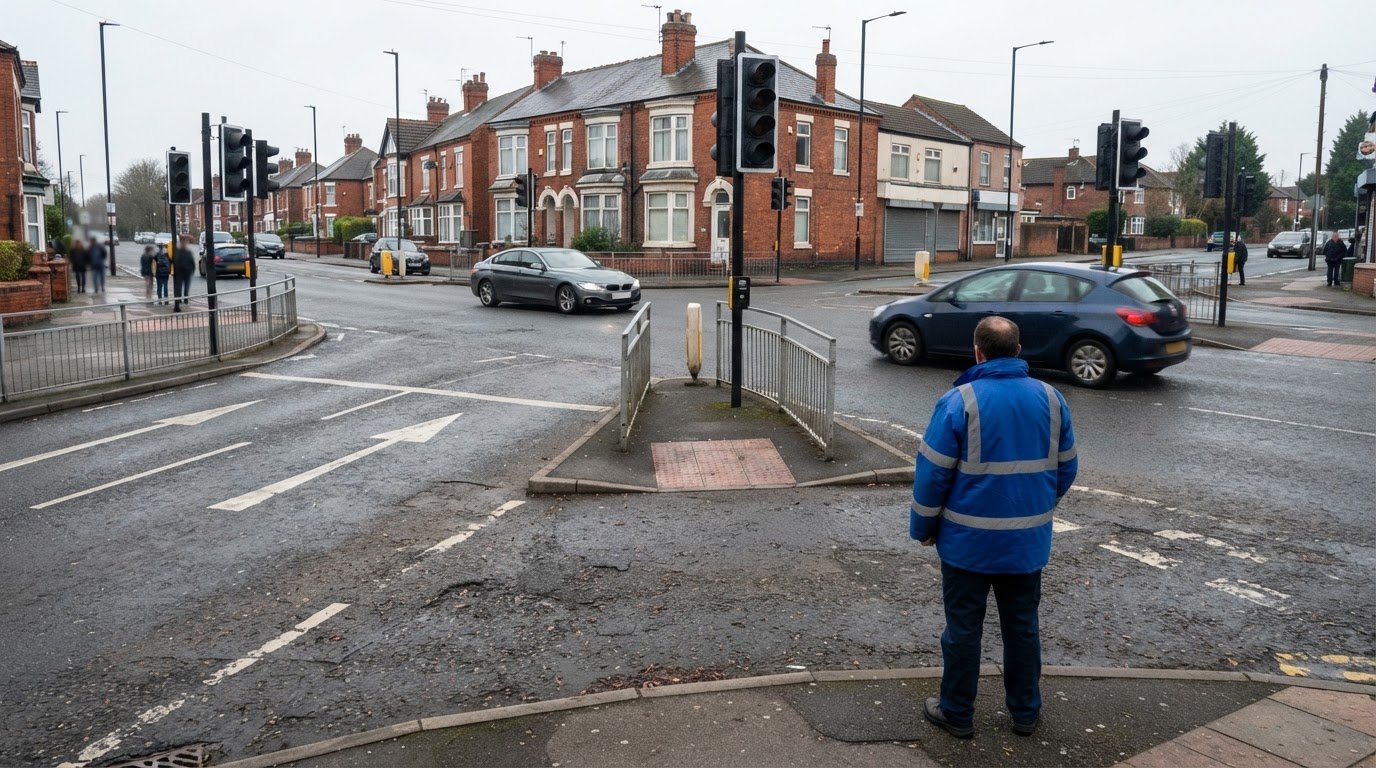
Great Britain’s personal injury collision data is published annually, not in real time. The Department for Transport says most road safety statistics are based on personal-injury collisions reported to police through STATS19; the national dataset can omit the latest 9-20 months of collision data, depending on the time of year. Understanding what a personal injury collision (PIC) data analysis can tell you starts with recognising that time lag.
A personal injury collision (PIC) data analysis examines recorded collisions and casualties to identify patterns, compare locations and highlight possible road safety priorities. The figures can show where reported collisions are concentrated and how trends change, but their meaning depends on the dataset’s coverage, reporting period and recorded details. This guide explains how Great Britain’s collision data is collected and maintained, what it contains, and how to interpret trends and hotspots carefully. It also explains how traffic surveys and transport analysis can add context when assessing movement and development around a location.
Key Takeaways
- Use STATS19 collision records to understand reported personal injury collisions, while accounting for gaps between collisions occurring and data being published.
- Read collision trends in context: changes in reporting or recorded factors can affect comparisons over time.
- Look beyond total collision counts by considering severity, location and the patterns in the recorded circumstances.
- Treat hotspot analysis as a way to identify locations for closer assessment, not as a complete explanation of why collisions occur.
- For development-related movement and access questions, Swept Path Analysis can help assess how vehicles move through a site.
Department for Transport and police-supplied STATS19 collision data
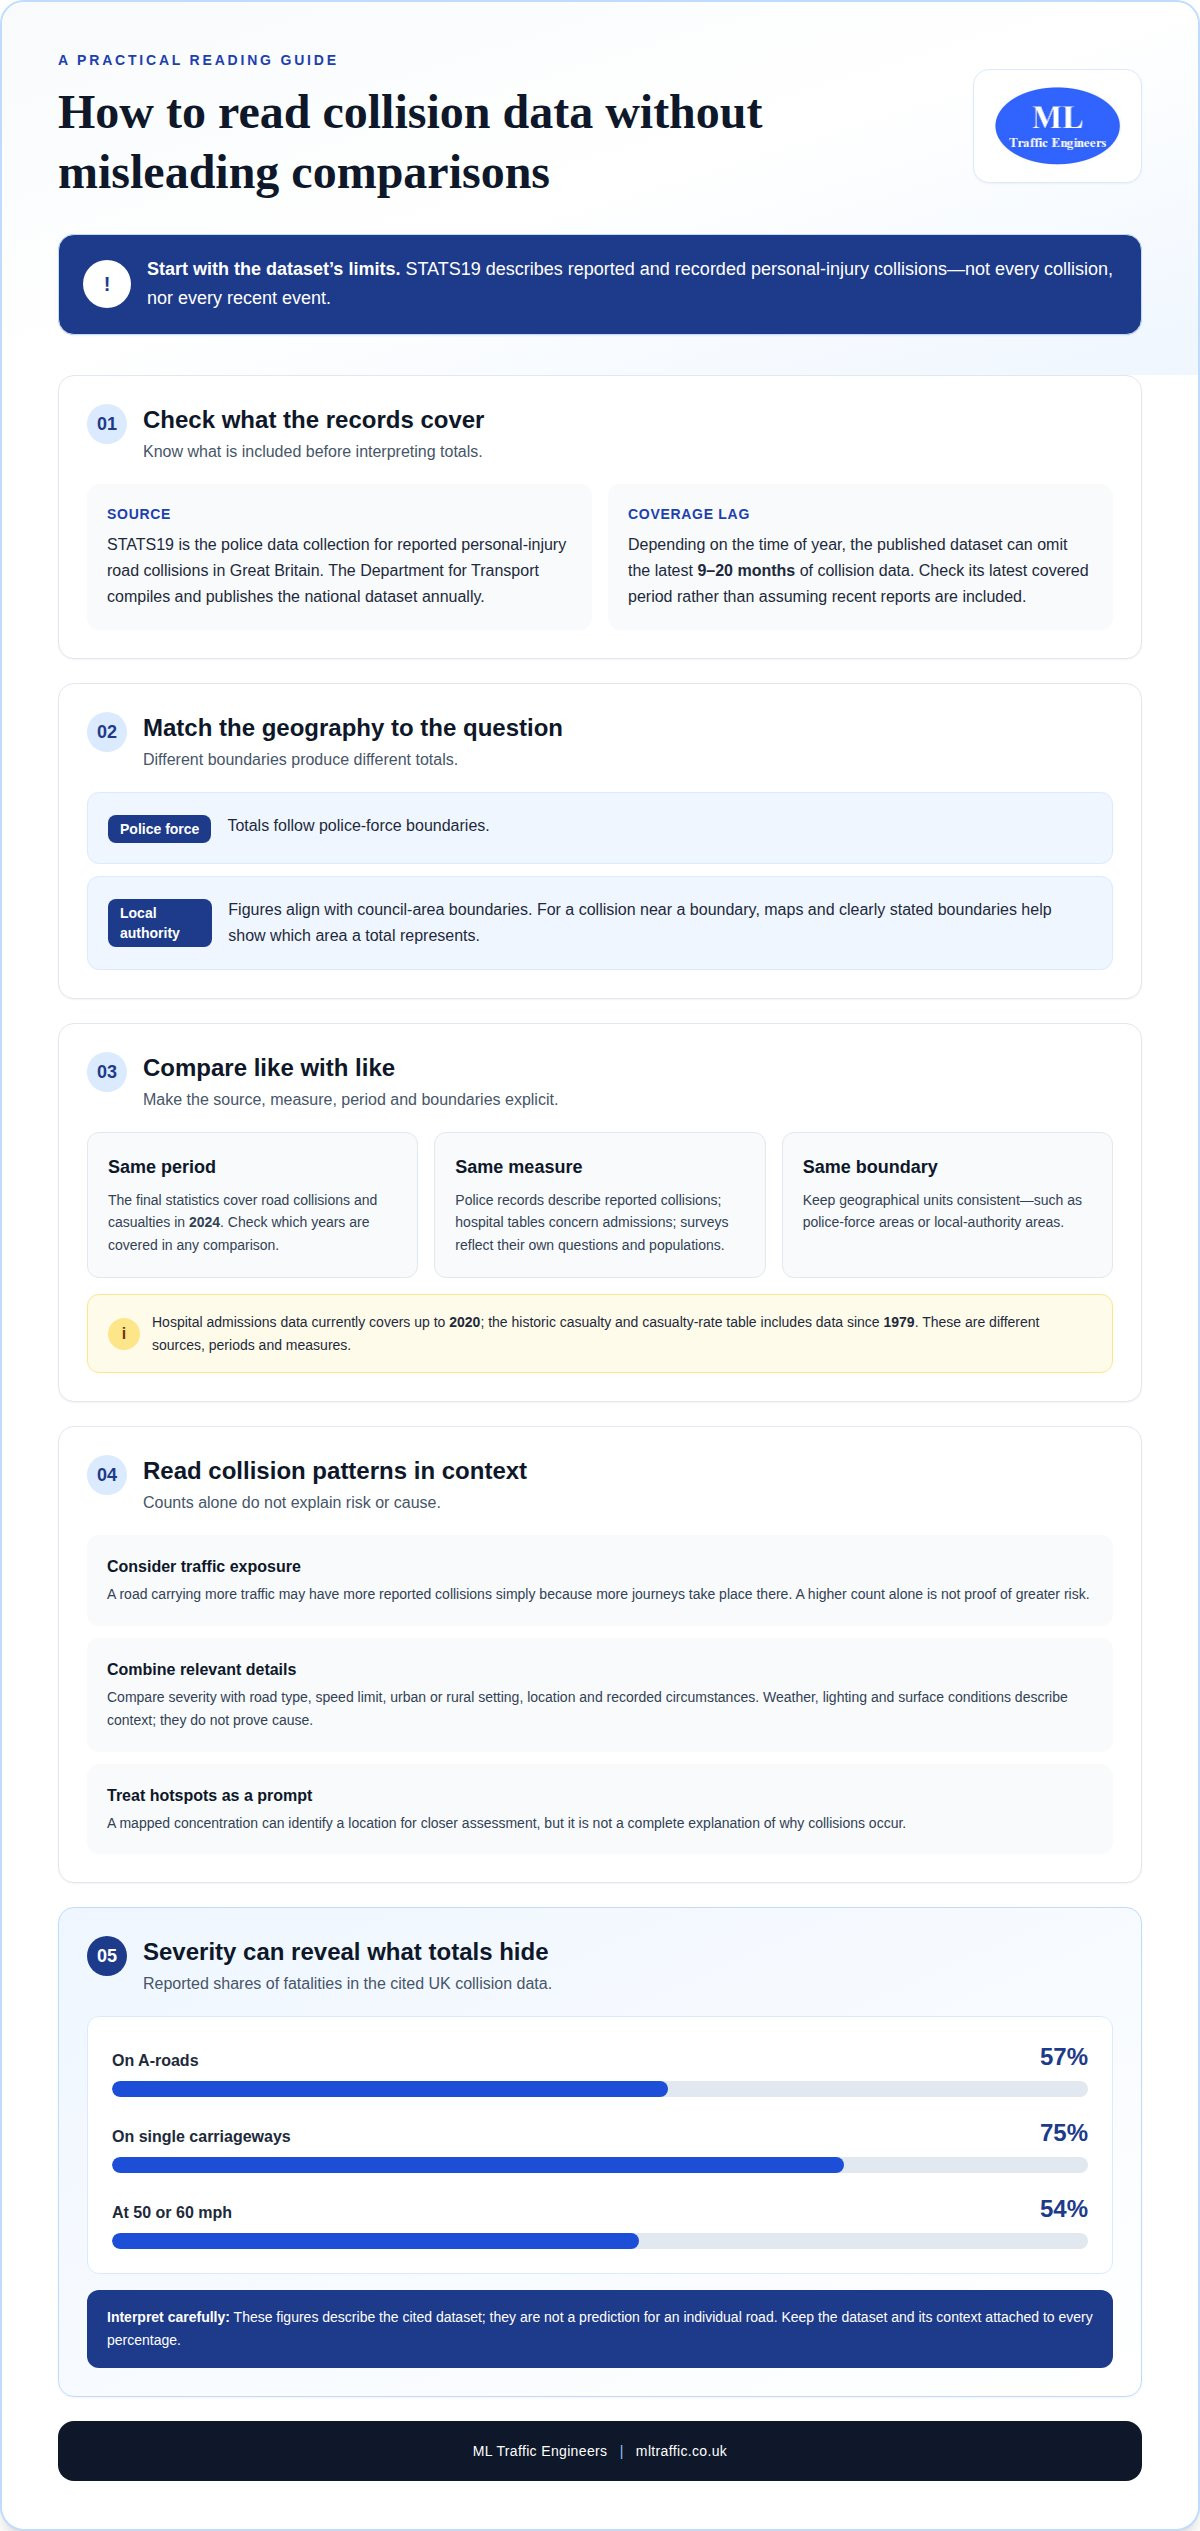
STATS19 is the police data collection used for reported personal-injury road collisions in Great Britain. The Department for Transport publishes the national collision dataset annually, allowing analysis across defined reporting periods and geographical areas.
STATS19 Data Sources
STATS19 records are supplied by police and compiled for the Department for Transport’s national road safety statistics. They provide a consistent format for examining reported collisions and casualties. The dataset’s coverage period is an important consideration when selecting records for an analysis.
Records can be organised by police force, region or local authority. Each breakdown answers a different geographical question: police-force totals follow force boundaries, while local-authority figures align with council areas. A collision near a boundary may affect travel on both sides, so maps and clear boundary definitions help show which area a total represents.
National publication timing affects how current a comparison can be. Depending on the time of year, the Department for Transport dataset can omit the latest 9-20 months of collision data. A review of a particular road should therefore identify the dataset’s latest covered period, rather than assuming the annual publication includes every recent report.
Police and Other Casualty Data
Police casualty data describes casualties linked to collisions reported through STATS19; hospital and survey data come from separate collection processes. The published table for hospital admissions data on road casualties currently covers data up to 2020. The historic casualty and casualty-rate table includes data since 1979, giving a different time span and measure.
These sources should not be treated as interchangeable. A police record describes a reported collision, while a hospital admission table concerns admissions. Survey findings reflect the survey’s questions and population. For example, a comparison between a recent STATS19 year and hospital data ending in 2020 would cover different periods. State the source, measure and dates so readers can interpret the comparison correctly.
Police-Reported Personal Injury Collisions
A police-reported personal injury collision is a road collision involving injury that is reported to police and included in the relevant dataset. Whether it appears in a dataset depends on that dataset’s coverage and inclusion rules. State those rules and the geographical unit used, such as a police force area or local-authority boundary.
Access and analysis must respect applicable UK data-protection and privacy requirements. Use published aggregate information when examining totals, and handle any more detailed records under the controls that apply to them. The main limitation is coverage: STATS19 represents reported and recorded collisions, so reporting and recording practices can shape apparent trends. Treat a mapped concentration as a prompt for closer assessment, not as proof of cause.
Reported personal injury road collision data for Great Britain
STATS19 records provide a structured basis for examining reported personal-injury collisions across Great Britain. Reading road type, speed environment and casualty severity together gives more useful road safety context than any single total.
Recorded Collision Information
Recorded collision information is the set of details captured about a reported collision, its location and the people involved. The Department for Transport’s final statistics cover road collisions and casualties in 2024, giving analysts a defined year for national comparisons. STATS19 records can be grouped by road characteristics and collision circumstances, allowing traffic patterns to be examined alongside casualty outcomes.
Weather, lighting and road-surface conditions help describe the circumstances around a collision, but they do not prove its cause. For example, a recorded wet surface does not by itself show that the surface caused the collision. Compare these details with the road layout, location and severity, and use a consistent reporting period.
Road Type and Speed Limit Breakdowns
A road-type and speed-limit breakdown compares collision records across different road settings and posted speed environments. It can distinguish an A-road from a minor road, for example, or a higher speed-limit route from an urban street. Urban and rural classifications add context, showing whether a pattern is concentrated in built-up areas or outside them.
Collision counts need context. A road carrying more traffic may have more reported collisions simply because more journeys take place there. When comparing roads, consider traffic exposure as well as collision totals, and do not treat a higher count alone as proof of greater risk. Comparisons are most useful when road categories, periods and geographical boundaries match.
Collision Severity
Collision severity classifies outcomes by the seriousness of the harm recorded, rather than counting every collision as equivalent. Analysing severity alongside road type and speed limit can reveal patterns hidden by total counts. In one set of UK collision data, 57% of fatalities occurred on A-roads, while 75% occurred on single carriageways. These figures describe that dataset, not a prediction for an individual road.
Speed-limit categories also need careful interpretation. One UK collision dataset reported that 54% of fatalities occurred at 50 or 60 mph. This does not establish that the speed limit alone determined those outcomes. Compare severity across matching road types and consider the road’s layout and traffic context before drawing conclusions about a location.
For planning work, collision patterns are one part of understanding how a proposed development relates to its surrounding network. A transport assessment’s planning context can help frame road and movement evidence alongside the development being considered.
Using collision data to identify trends and priority locations
Collision analysis compares recorded incidents across locations, periods and casualty outcomes to identify patterns that may warrant closer examination. Consistent boundaries and measures of traffic exposure help distinguish a meaningful difference from a higher raw count.
Trend Identification
Trend analysis compares collision records over time or between places using consistent categories. Records can be grouped by severity, road type, period or location to assess whether a pattern persists. A rise in one category may be local or part of a wider change. Comparisons should account for dataset coverage and changes in how factors are recorded.
Potential priority locations can be screened using collision clusters, defined by the number, severity and proximity of recorded incidents over a stated period. The cluster definition should specify its distance boundary, time window and severity threshold. Applying the same rule throughout a study area makes locations easier to compare, but a threshold alone does not explain why collisions occurred.
Counts and rates answer different questions. A road with more traffic may record more collisions because more journeys use it. For comparing multiple roads, the expected collision rate can be expressed per 100 million vehicle miles. This exposure-based measure provides context for raw totals, though analysts still need comparable periods and consistent road definitions.
Analysis Software and Methods
Analysis software can organise records, map locations and compare categories. A geographic information system can display collision points against a road network, while spreadsheet or database tools can filter records by period, severity and road type. Choose a method that fits the question: a map shows spatial concentration, while a rate comparison can account for differences in traffic exposure.
To analyse UK personal injury collision data, define the study area and period, standardise categories, and compare like-for-like records. Specify whether the result counts collisions, casualties or severity outcomes. This matters because one collision can involve multiple casualties. Record the boundary and measure used so the comparison can be reproduced.
A proposed model treats the number of collisions on a road as a Poisson random variable, with expected count based on the underlying collision rate multiplied by vehicle miles travelled. A proposed rate-comparison method estimates the p-value using 1,000,000 Monte Carlo simulations. These methods test whether differences between roads may reflect variation in counts.
One proposed method for casualty rates simulates collision counts and samples casualties per collision from the observed distribution to calculate confidence intervals. These intervals express uncertainty around an estimated rate, not its cause. A robust analysis reports its assumptions, exposure measure and period alongside any priority locations identified.
How injury collision data is collected and maintained
UK collision datasets are compiled from police reports, then updated, checked and published according to defined coverage rules. Before comparing collision totals, record the dataset version, reporting period and inclusion criteria. This makes clear what each figure represents and whether records from different releases can be compared consistently.
STATS19 is the police collection used for reported personal-injury collisions in Great Britain. Its national collision dataset lists 31 December 1999 as its coverage start date and is published annually by the Department for Transport. Each release therefore represents a defined period, rather than a continuously refreshed national record. Check the period covered before using a figure to describe current conditions.
National release dates do not mean every recent collision is already included. Depending on the time of year, the Department for Transport dataset can omit the latest 9-20 months of collision data. Local datasets may provide a different update cycle and coverage. Keep the source and extraction date with any analysis, so later updates are not confused with a change in collision patterns.
Historical tables extend the available time series, but they do not all measure the same thing. The historic road collision, casualty and vehicle table includes data since 1926; the historic casualty and casualty-rate table includes data since 1979. Select the series that matches the question, then retain its definitions and units when comparing years. A collision count and a casualty rate are not interchangeable measures.
Classification changes also affect the continuity of records. Some police forces began replacing contributory factors with road safety factors from late 2023, creating a break in the time series for some data. When a comparison crosses that change, separate the periods or explain the classification difference. Otherwise, a change in coding may look like a change in recorded circumstances.
Provisional data is a release that may change while verification continues. Mark provisional records clearly in working files and reports, and distinguish them from final statistics. A later release may revise earlier records, changing the total without indicating a new collision or a change in risk.
For a defensible comparison, document the dataset name and version, geography, dates, inclusion rules and coding categories. Check whether both periods use the same definitions and whether the latest records are complete. These steps make the analysis’s limits clear and help readers understand whether a difference reflects road conditions, coverage or changes in data processing.
What information is recorded in UK personal injury collision data?
Personal injury collision data records details about collisions involving injury and the circumstances captured by the relevant collection. In STATS19, contributory factors use specific codes, while Northern Ireland records some conditions only for collisions with serious or fatal casualties.
A contributory factor is a coded circumstance recorded as potentially contributing to a collision. It is not, by itself, a finding that a factor caused the collision. Codes can vary by road-user type: “Impaired by alcohol” uses code 501 for drivers and code 806 for pedestrians. Analysts should retain the code and its description when grouping records.
Drug-related impairment also has separate STATS19 codes for drivers and pedestrians. “Impaired by drugs” uses code 502 for drivers and code 807 for pedestrians. Keeping these categories distinct avoids combining records that apply to different road-user groups. It also makes the coding basis clear when comparing contributory-factor totals.
Environmental conditions describe the recorded weather, light and road surface around a collision. In Northern Ireland, these details are collected only for collisions resulting in a serious or fatal casualty. An analysis of these conditions therefore covers a defined subset, not every injury collision. State this limitation when presenting a chart or comparison.
Location fields support mapping collisions to the road network. The draft revised STATS19 form validated Eastings from 0 to 500,000 and Northings from 500,000 to 1,300,000. These coordinate ranges help identify values outside the form’s stated validation limits. A mapped point still needs checking against the relevant road or junction location.
Factor categories also change over time. Some police forces began replacing contributory factors with road safety factors from late 2023, creating a break in some time series. A comparison spanning that change should identify which classification applies to each period. Otherwise, a shift in recorded labels could be mistaken for a change in collision circumstances.
For analysis, preserve each record’s category, code, location and applicable coverage limits. For example, separate Northern Ireland weather records by casualty severity before comparing conditions. Keep driver code 501 distinct from pedestrian code 806 when reviewing alcohol impairment. These steps make the scope of each finding transparent and reduce misleading category comparisons.
ML Traffic Engineers UK: Swept Path Analysis
ML Traffic Engineers UK provides Swept Path Analysis to assess how vehicles can manoeuvre through a proposed site. Collision data can reveal broader patterns, while swept path drawings help assess vehicle access and movement at a specific development. This service is relevant when a project requires assessment of vehicle routes, turning movements or access arrangements.
For wider planning context, a Transport Statement or Transport Assessment can address transport matters associated with a development. A Parking Survey can provide evidence about parking conditions when relevant to the project. The right work depends on the planning question and the site’s transport requirements.
To discuss development-related vehicle movement or transport documentation, contact ML Traffic Engineers UK.
Turn collision evidence into a planning decision
The next step is to connect collision evidence to the specific planning question. A useful analysis helps frame what needs assessing around a site, rather than treating a dataset as a complete account of local transport conditions. Understanding what a personal injury collision (PIC) data analysis can and cannot establish provides a sound basis for deciding what further project evidence is relevant.
For development proposals, ML Traffic Engineers UK provides Transport Statements, Swept Path Analysis and Parking Surveys. These services address different project needs, from documenting transport matters to assessing vehicle movement and parking conditions. The appropriate next step depends on the planning question and the evidence required for the site.
If you’re preparing a proposal and need transport evidence tailored to its planning context, contact ML Traffic Engineers UK to discuss the project. A clear scope can help keep the next stage focused and practical.
Frequently Asked Questions
How up to date is the data?
The national STATS19 dataset is published annually, but its newest records can lag behind current conditions. “Latest available” therefore doesn’t necessarily mean current through today. For a site-specific decision, compare the published coverage period with local data updates and note whether recent records remain provisional.
Where does the data come from?
Most Great Britain road safety statistics come from personal-injury collisions reported to police through STATS19, according to the Department for Transport. Police-supplied records form the national dataset, while local authorities may also publish collision information for their areas. Northern Ireland has a separate police data process, so a UK-wide view needs care: datasets can differ in geography, collection and inclusion rules.
What does personal injury collision (PIC) data analysis mean in the UK?
A personal injury collision (PIC) data analysis examines recorded road collisions involving injury to identify patterns in location, timing, severity or circumstances. It can show where reported collisions are concentrated and how recorded outcomes vary between road types. It analyses available records; it does not determine legal fault or prove that a particular feature caused a collision.
Where can I find official UK PIC or road collision datasets?
Start with the Department for Transport’s Great Britain road safety statistics and STATS19 publications for national data. Local authority open-data pages can provide area-level records, such as Cambridgeshire’s downloadable collision dataset. Northern Ireland publishes collision information through its own dashboard and statistical releases. Before using a file, note its geographic coverage, publication date and data period so you select a dataset suited to your question.
How is UK road collision data collected and coded by police?
Police record collision details and casualty information through the STATS19 collection, using defined categories to make records comparable. Fields can cover the collision location, people involved and recorded circumstances. Category changes matter: a force adopting a revised factor classification can affect comparisons across years. Analysts should retain the dataset’s coding definitions and record which categories apply to each period.
How do analysts calculate collision rates, severity and trends from PIC data?
Analysts compare like-for-like periods and locations, then separate collision counts from casualty counts and severity outcomes. A rate comparison can relate collision numbers to vehicle miles travelled, which accounts for differences in road use. For example, a busier road may record more collisions but also carry more traffic. Trend analysis should also account for classification changes and uncertainty in the underlying counts.
How is PIC data used for road safety planning and collision investigations?
PIC data can help identify locations or patterns for closer road safety assessment, guide decisions about where to examine conditions, and support investigation of collision circumstances. It should inform, not replace, a site-specific review. Access to detailed records may also be restricted: Cambridgeshire shares collision descriptions and contributory factors only with parties involved in accident investigation, remedial works or safety engineering.

Disclaimer
The content on mltraffic.co.uk, including all technical articles, guides, and resources, is provided for general informational and educational purposes only. It is not intended to constitute professional advice in traffic engineering, transportation planning, development approvals, or any other technical or legal field.
While ML Traffic Engineers makes every reasonable effort to ensure the accuracy, completeness, and timeliness of the information published, we do not provide any warranties or representations (express or implied) regarding its reliability, suitability, or availability for any particular purpose. Any reliance you place on the content is strictly at your own risk.
In no event shall ML Traffic Engineers, its directors, employees, authors, or affiliates be liable for any direct, indirect, incidental, special, consequential, or punitive damages (including, without limitation, loss of profits, data, or business opportunities) arising out of or in connection with the use of, or inability to use, any information provided on this website.
The articles and guides on this site are not a substitute for engaging a qualified, professional traffic engineer to assess your specific project requirements. For tailored advice, compliance assessments, or traffic engineering services, please contact a competent professional.
This disclaimer may be updated from time to time without notice. By accessing or using this website, you agree to be bound by the most current version of this disclaimer.