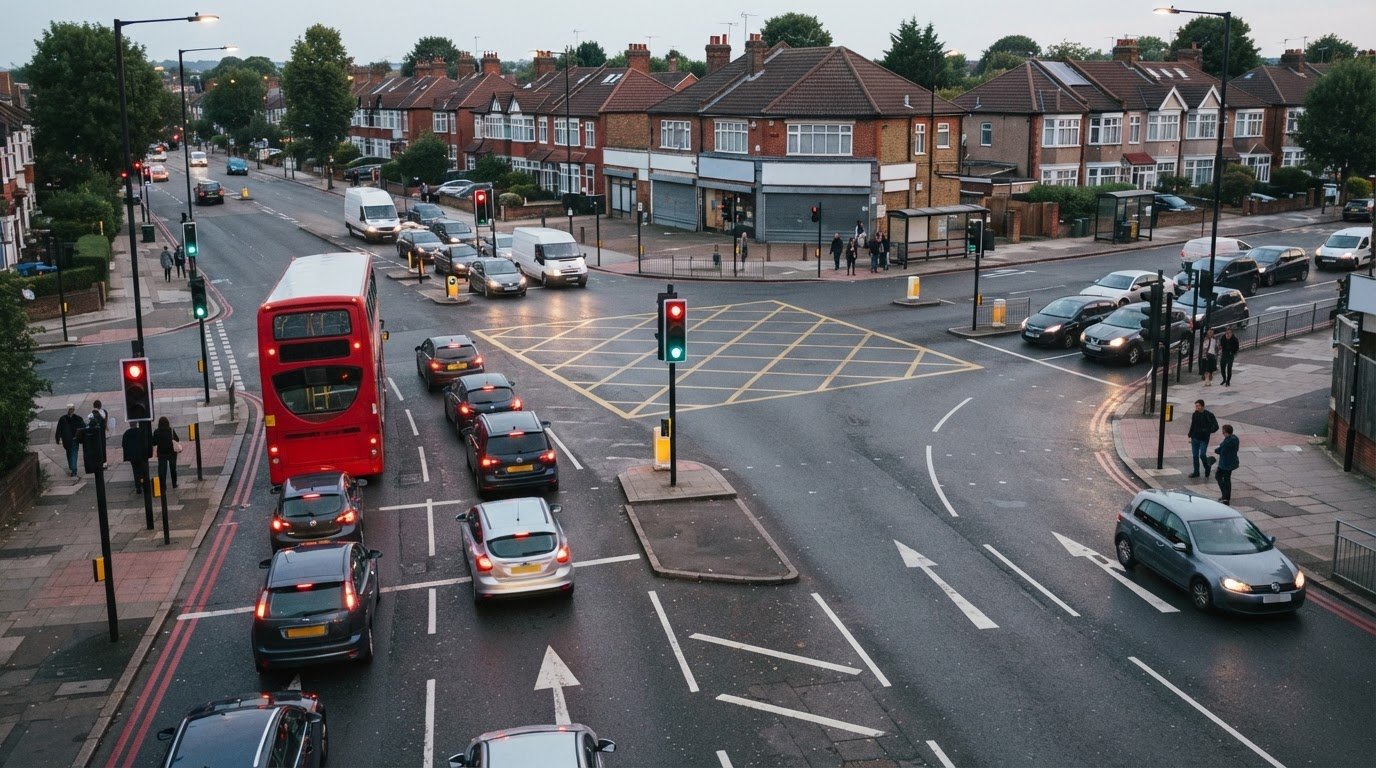
A junction that appears to operate smoothly can still become a constraint as traffic demand changes. So, what is a junction capacity analysis? It is a technical assessment of how a junction is expected to handle traffic under specified conditions, and where its capacity may come under pressure.
For development planning, the purpose is not simply to count vehicles. The analysis models traffic movements and junction operation, then uses the results to identify critical movements, calculate volume-to-capacity ratios and assess level of service. These findings help show whether a proposed development could add pressure to the surrounding network.
This guide explains how to prepare traffic inputs, model junction performance and interpret the results. It covers how signal phases affect capacity, what critical movement and phase volumes reveal, and how an assessment can identify potential bottlenecks and inform planning decisions. The focus is practical: understanding the outputs and how they support an evidence-based view of junction performance.
Key Takeaways
- Build a reliable traffic model from junction layout, lane numbers and movement volumes, with hourly flows adjusted to reflect the peak 15-minute period.
- Use volume-to-capacity ratios to see how demand compares with the capacity available for each movement and where pressure may be concentrated.
- Interpret level of service alongside queues and delay to understand how junction performance affects road users.
- Identify critical movements and phase volumes to understand which traffic flows influence signal timing and overall junction operation.
- For development planning, use the findings to identify potential network constraints and inform the supporting transport assessment or statement.
Predicting traffic flow with junction modelling software
A junction capacity analysis requires the junction layout, lane numbers and traffic volumes for each movement. The process is to gather and assign those inputs, account for peak conditions, then model how the junction operates.
Gather the Required Data
Start by recording the junction layout and the traffic movements using each approach. Include the number of lanes, turning directions and hourly traffic volumes, as these inputs define the model. For example, separate left-turning, straight-ahead and right-turning flows where the layout allows. Avoid combining movements that use different lanes or follow different routes through the junction.
Assign Hourly Volumes to Lane Movements
Next, assign each movement’s hourly traffic volume to the lane or lanes serving it. The lane count is needed to calculate hourly traffic volumes per lane. For example, represent both turning and straight-ahead flows in a shared lane, rather than treating it as two separate lanes. Check the assignments against the junction layout so the model reflects how vehicles can actually approach and exit.
Adjust Volumes for Peak Periods
Then adjust hourly flows to represent the busiest part of the hour. Junction capacity analysis commonly uses an adjustment for the peak 15-minute period, since an hourly average can conceal short periods of heavier demand. Apply the adjustment consistently across the movements being assessed. This gives the model a more demanding traffic profile than an unadjusted hourly total and helps expose where capacity may become constrained.
- Choose a model suited to the junction. Select software that matches the control type and network being assessed. LINSIG, TRANSYT and SYNCHRO are options for isolated or linked signalised junctions, signalised roundabouts and small networks. Set up the model using the recorded layout, lane assignments and adjusted movement volumes.
- Represent the operating conditions. Enter the traffic flows and signal operation relevant to the assessment, then model how vehicles move through each approach. Keep the lane use and turning patterns consistent with the collected inputs. If a movement shares a lane, represent that interaction in the model rather than assuming independent lanes.
- Review the simulated results. Compare how the model handles the assigned demand across the junction, paying attention to movements that face concentrated flows or limited lane choices. Test the defined traffic conditions consistently, then retain the outputs for interpreting capacity and performance in the following assessment steps.
For developers, the assessment can show how a junction is expected to perform under different traffic conditions. This helps explain how changes in the conditions being assessed may affect junction operation.
Calculating the critical volume-to-capacity ratio
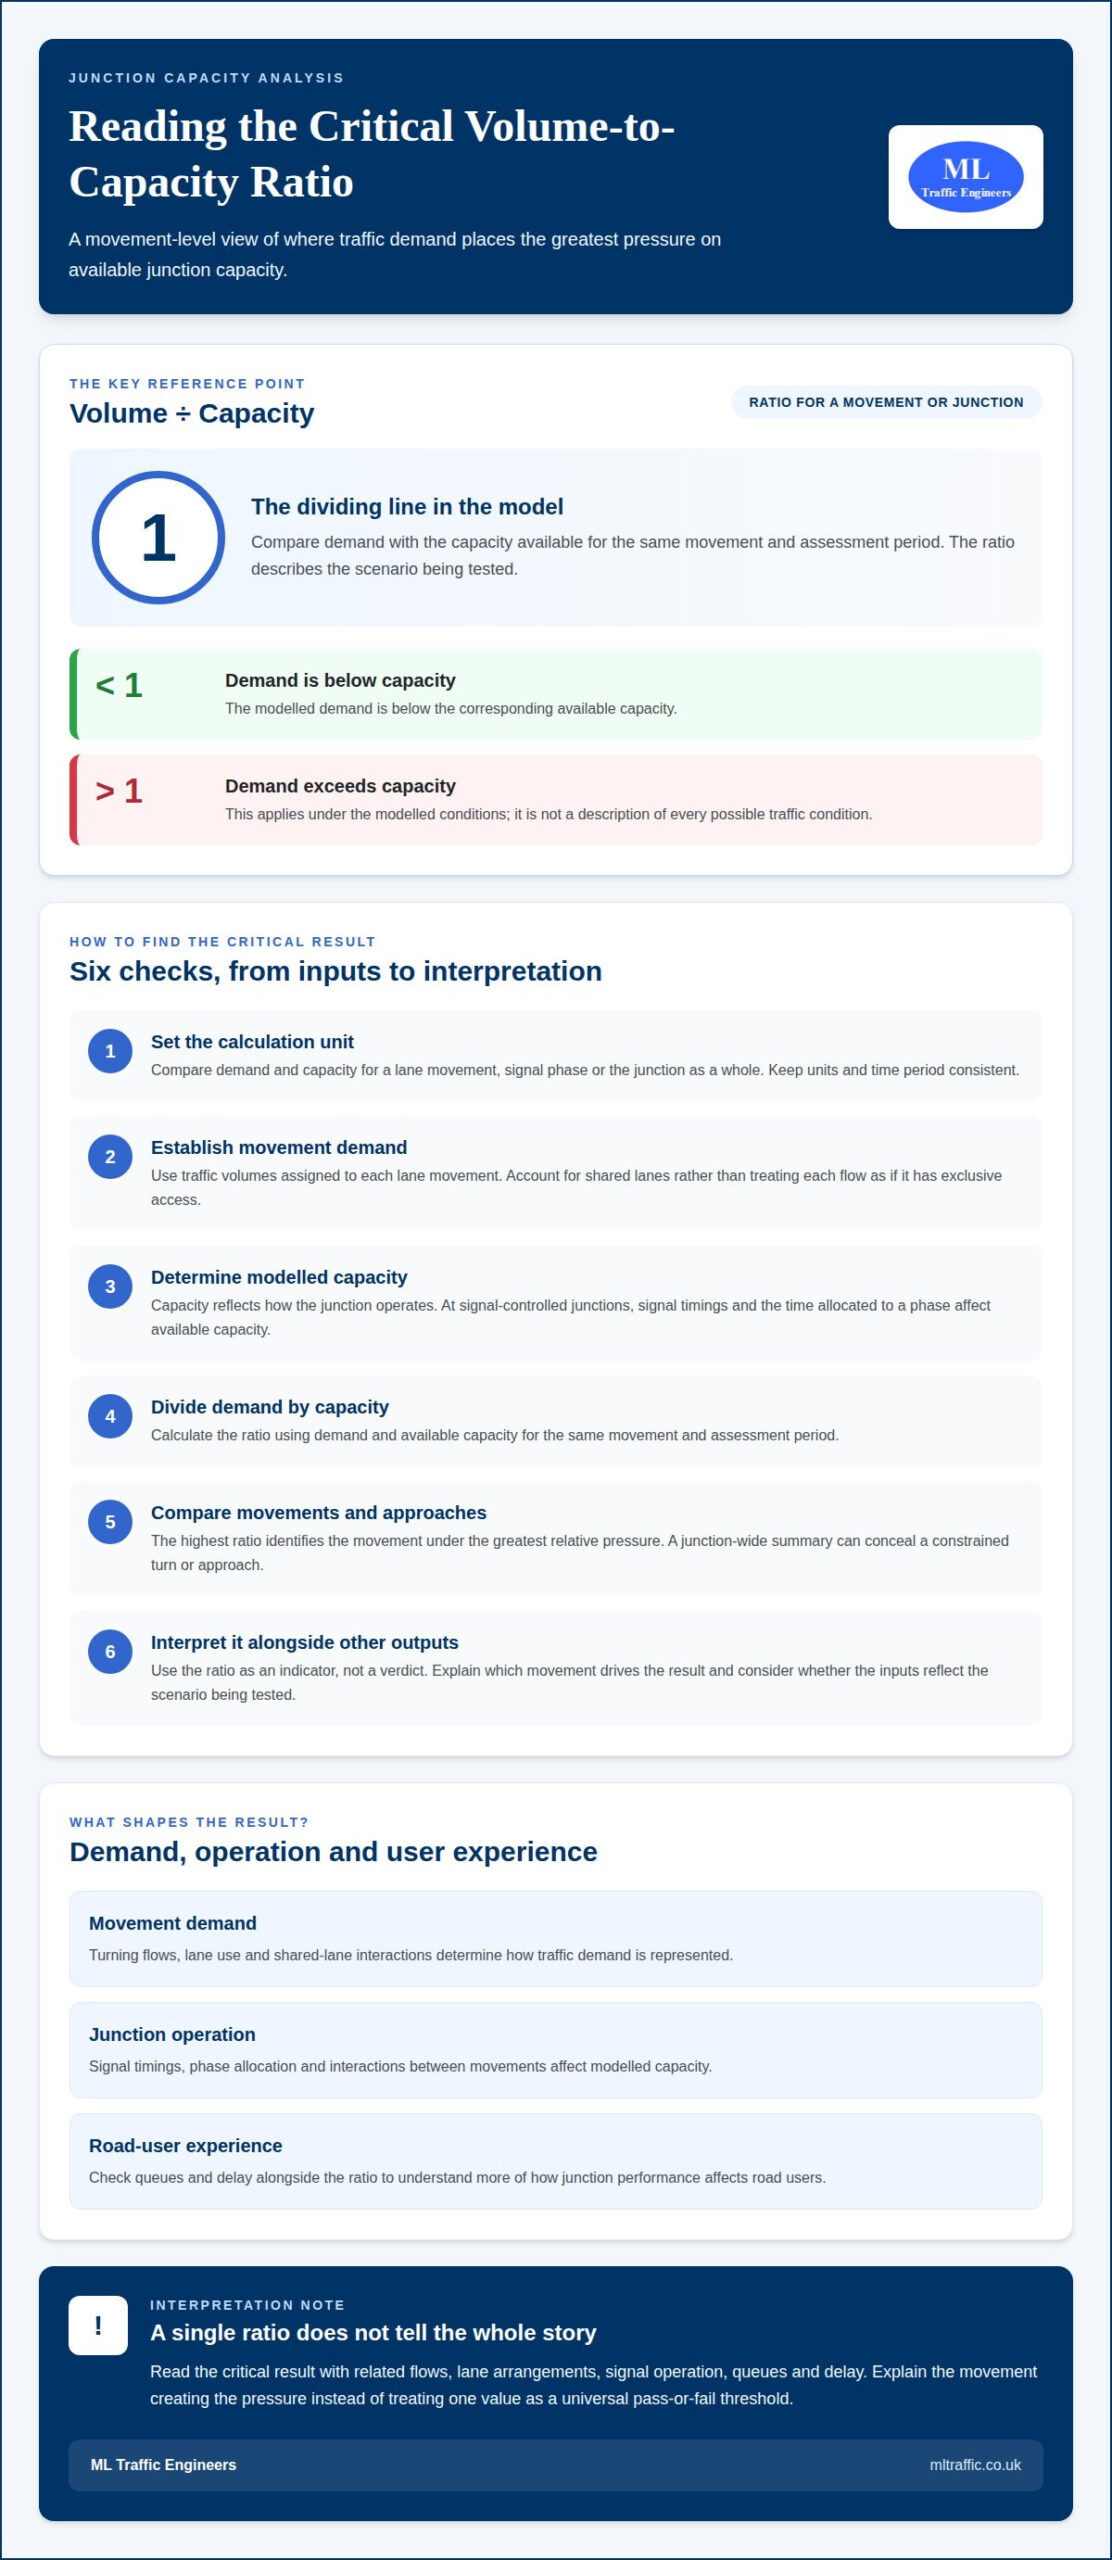
In the UK, analysts compare traffic demand with the capacity available to serve it. The volume-to-capacity ratio expresses this relationship for a movement or junction. The critical result shows where demand places the greatest pressure on capacity.
- Set the calculation unit. Identify whether demand and capacity are being compared for individual lane movements, signal phases or the junction as a whole. Keep the units and time period consistent. A movement’s hourly demand must be compared with capacity for the same movement and assessment period.
- Establish demand for each movement. Use the traffic volumes assigned to each lane movement in the model. Separate turning flows where they use different lanes or compete for different parts of the junction. If a lane serves more than one movement, account for the shared use rather than treating each flow as if it had exclusive access.
- Determine the modelled capacity. Capacity depends on how the junction operates, not just its physical layout. At a signal-controlled junction, a movement’s available capacity is affected by signal timings and the time allocated to its phase. For other junction types, the model represents the relevant operating conditions and interactions between movements. Use the model output that corresponds to the demand being assessed.
- Compare demand with capacity. Divide a movement’s demand by its available capacity to obtain its volume-to-capacity ratio. A ratio below one means modelled demand is below the corresponding capacity; a ratio above one means demand exceeds it under the modelled conditions. These comparisons describe the scenario tested, not every possible traffic condition.
- Identify the critical result. Compare ratios across movements and approaches. The highest ratio marks the movement under the greatest relative pressure, but it should not be read in isolation. Check related flows, lane arrangements and signal operation to understand why that movement is critical. A junction-wide summary can conceal a constrained turn or approach, so retain movement-level results when interpreting performance.
- Use the ratio as an indicator, not a verdict. The ratio helps locate pressure points, but does not describe every aspect of road-user experience. Interpret it alongside other model outputs, including queues and delay, and consider whether the inputs reflect the scenario being tested. Avoid treating a single value as a universal pass-or-fail threshold. Instead, explain which movement drives the result and how it affects junction operation.
For a development proposal, connect the movement-level findings to the wider transport evidence in a Transport Assessment. This helps place capacity results in context, rather than presenting one ratio as the full account of network impact.
Determining intersection status and level of service
- Read the model outputs together. Start with the reported volume-to-capacity results, queues and delays for each approach. No single output describes the whole junction. For example, a junction-wide summary may look acceptable while one turning movement experiences substantial delay. Record results by approach and movement before forming an overall view of operating conditions.
- Assess the level of service. Treat level of service as a way to describe how junction operation feels to road users, using modelled performance such as delay and queuing. It helps communicate technical results in practical terms. Read the reported category alongside the underlying outputs, rather than relying on its label alone. The category describes the modelled scenario, not every condition on the road.
- Locate the source of delay. Trace queues and delays back to the movement or approach where they occur. At a signal-controlled junction, consider how phase allocation affects the time available to serve competing flows. A queue on one approach may indicate a local constraint, while delays across several approaches may point to a broader operational issue. Use movement-level results to distinguish these patterns.
- Check whether queues affect adjacent movements. Compare the modelled queue with the lane arrangement and nearby junction movements. A queue can affect more than the approach where it forms if it obstructs another lane or restricts access to a turning movement. For example, a shared lane may experience different effects from a lane reserved for one movement. Interpret queue results in the context of the layout.
- Compare scenarios consistently. When reviewing existing and forecast conditions, keep model assumptions consistent so the differences reflect the scenarios being tested. Compare the same approaches, movements and performance outputs in each run. Note where demand or signal operation changes the result. This can show whether a change affects one critical movement or alters the junction’s overall operation.
- Describe the operational status clearly. Summarise the level of service alongside supporting delay, queue and capacity findings. State which approach or movement drives the result, then explain what it means for junction operation. Avoid presenting a single category as proof that every movement performs alike. A clear account links model outputs to specific traffic flows and the conditions represented in the assessment.
Keep lost time in view when explaining a movement-level result. Lost time at an intersection depends on cycle length and the number of protected left turns. Consider this relationship when explaining modelled delay, and describe the inputs represented in each run rather than treating the reported level of service as a complete explanation. When comparing alternatives, identify whether cycle length or protected left turns differ, and connect any stated difference to the results only where the model supports it.
Use this as a check on the explanation, not a substitute for approach and movement outputs. If results show a change in delay or queues, compare that change with the cycle length and protected-left-turn assumptions recorded for the scenario. If those inputs are unchanged, do not attribute the performance difference to them; refer instead to other documented model changes. This keeps the operational summary tied to the assessed conditions and avoids implying that one category explains how signal operation affects every movement.
Identifying critical movements and phase volumes
- Map each movement to its route through the junction. Identify turning and straight-ahead movements on every approach, then note which lanes serve them. This movement-by-movement view distinguishes a heavily used turn from the total approach flow. For example, a shared lane may carry both straight-ahead and turning traffic, while a separate lane serves another movement.
- Group compatible movements into signal phases. A signal phase typically accommodates two non-conflicting movements. Review which movements can receive a green signal together and which must wait because their paths conflict. Record each phase as a group of movements, not simply as a list of approaches. This shows how the signal plan distributes time across traffic flows.
- Identify the critical movement within each phase. Compare demand for movements served during that phase, taking account of how their lanes operate. The critical movement is the one that most influences the phase’s capacity requirement. It may be a turning flow with limited lane access, rather than the approach with the largest combined hourly volume. Keep movement-level volumes visible during this comparison.
- Relate critical volumes to phase timing. The critical movement volume determines the time assigned to a signal phase in each cycle. A phase serving a more demanding critical movement may require more green time. Assess that requirement alongside the other phases, because time allocated to one phase affects the time available to serve the others.
- Review phase volumes across the junction. Compare demand in each phase and check that every movement appears in the appropriate phase. For example, confirm that a right-turn flow is not omitted or counted twice when it shares a lane. This review connects the model’s phase structure with the actual movement pattern and helps prevent a misleading interpretation of critical demand.
- Trace how the critical movement shapes the result. Follow the movement from its assigned lane through its phase and into the model outputs. Check whether its demand corresponds with reported capacity pressure, queue or delay. If another movement appears to drive the result, revisit the phase grouping and lane allocation. A clear explanation identifies the critical movement and shows how its volume influences signal operation.
- Report phase volumes in operational context. Present the critical movement for each phase alongside the other movements it serves. Explain which movements operate together, which compete for separate signal time, and how critical volume affects phase allocation. This gives decision-makers a traceable account of signal operation, rather than a junction-wide figure that hides the movements shaping performance.
Junction capacity analysis for planning
For planning, use the assessment to show how a proposed development may affect junction operation. The findings should connect traffic demand and capacity with the specific movements under pressure.
Apply UK Guidance and Standards
Start by defining the assessment scope and modelling approach for the planning context. Apply the relevant highway authority’s requirements and keep assumptions consistent across the junction types being assessed. Transport authorities may request a capacity assessment when they consider a development’s impacts significant. Explain the method and operating conditions behind the model outputs.
Include Future Growth and Development Impacts
Build a future scenario that represents the development’s traffic alongside the background demand being assessed. Separate trips associated with the proposal from other traffic assumptions, then compare the resulting junction performance with the relevant baseline. This makes it easier to identify whether added demand changes a critical movement, queue or delay. Do not treat development trips as the only change in future conditions.
- Match the model to the junction type. At a priority junction, assess how traffic on the major and minor arms interacts, including the effect of gaps in the main flow. A roundabout model represents circulating traffic and entry interactions. A signalised junction model accounts for signal phases and allocated green time. The method differs because each layout controls conflicting movements differently.
- Set out the planning scenarios. Define the existing and future cases, then apply the same junction layout and assessment approach to each. Include development traffic in the future case and distinguish it from background flows. Compare movement-level outputs to see whether the proposal adds pressure to an already constrained turn or creates a new pinch point.
- Interpret results within their limits. Capacity models represent specified inputs and operating assumptions. They can identify potential bottlenecks, conflicts and safety risks, helping inform mitigation options, but they don’t reproduce every variation in real traffic behaviour. A result can change if demand, lane use or signal settings change, so explain which assumptions drive the finding.
- Connect the findings to the planning decision. Explain how modelled effects relate to the development and surrounding transport network. A capacity assessment helps evaluate whether infrastructure can accommodate demand and whether a proposal could overwhelm existing traffic systems. Present critical movements and their implications clearly, rather than relying on a single junction-wide figure.
For planning proposals that need this evidence brought together, discuss a Transport Assessment with ML Traffic Engineers UK.
ML Traffic Engineers UK: Swept Path Analysis
ML Traffic Engineers UK provides Swept Path Analysis to assess how vehicles can manoeuvre through a proposed access or site layout. It complements junction capacity findings when vehicle movements and physical geometry both matter to a planning proposal. For example, capacity modelling may identify traffic pressure at an access, while swept path analysis examines whether the relevant vehicles can navigate the layout. The results can support wider planning documentation, including Transport Statements and Transport Assessments. Turn to this service when a proposal needs vehicle manoeuvring evidence alongside its transport planning material. Explore the Swept Path Analysis process to understand how it fits a planning application. Contact ML Traffic Engineers UK to discuss your project.
Turn traffic evidence into a clear next step
Understanding what a junction capacity analysis can establish is useful when a planning decision depends on how traffic demand interacts with the road network. The next step is to connect the technical findings to the proposal’s wider transport evidence, so decision-makers can understand what the results mean for the site and its surroundings.
Keep the assessment focused on the planning question it needs to answer. Clear reasoning shows how the evidence supports the proposed development and where further transport planning work may be relevant. This makes the analysis more useful than a set of model outputs viewed in isolation.
If you’re progressing a development proposal and need support with its transport evidence, contact ML Traffic Engineers UK to discuss the next step. A considered approach can help you move forward with clarity and confidence.
Frequently Asked Questions
What is a junction capacity analysis?
A junction capacity analysis is a technical assessment of how traffic demand compares with a junction’s ability to serve it. It uses traffic and layout information to examine vehicle movements through arrangements such as priority junctions, roundabouts and signal-controlled junctions. For a development proposal, the assessment can help explain whether a change in access or surrounding demand may affect junction operation.
What is the purpose of a junction capacity assessment in transport planning?
Its purpose is to help assess how a development could affect the surrounding road network and whether existing junctions can accommodate the resulting demand. A transport authority may request an assessment when it considers a development’s effects significant. For example, a proposal with a new site access may need its junction effects examined as part of the planning evidence, helping decision-makers understand potential constraints and consider suitable mitigation.
What do RFC, degree of saturation and queue length mean in junction modelling?
The volume-to-capacity ratio compares traffic demand with available capacity: below one means demand is below capacity, while above one means it exceeds capacity under the modelled conditions. Queue results show where traffic backs up and whether it may obstruct another lane or restrict a turning movement.

Disclaimer
The content on mltraffic.co.uk, including all technical articles, guides, and resources, is provided for general informational and educational purposes only. It is not intended to constitute professional advice in traffic engineering, transportation planning, development approvals, or any other technical or legal field.
While ML Traffic Engineers makes every reasonable effort to ensure the accuracy, completeness, and timeliness of the information published, we do not provide any warranties or representations (express or implied) regarding its reliability, suitability, or availability for any particular purpose. Any reliance you place on the content is strictly at your own risk.
In no event shall ML Traffic Engineers, its directors, employees, authors, or affiliates be liable for any direct, indirect, incidental, special, consequential, or punitive damages (including, without limitation, loss of profits, data, or business opportunities) arising out of or in connection with the use of, or inability to use, any information provided on this website.
The articles and guides on this site are not a substitute for engaging a qualified, professional traffic engineer to assess your specific project requirements. For tailored advice, compliance assessments, or traffic engineering services, please contact a competent professional.
This disclaimer may be updated from time to time without notice. By accessing or using this website, you agree to be bound by the most current version of this disclaimer.