A fast food restaurant with drive through transport assessment can look straightforward on paper: one unit, one access, some parking, a lane wrapped around the building. In practice, it’s rarely that simple. These schemes generate a very particular traffic pattern, short-stay car trips, sharp peaks, queueing pressure, delivery activity, and a surprisingly high risk of internal layout problems spilling onto the public highway.
That’s why planning teams can’t treat a drive-through like a standard restaurant application with a few extra drawings. Local planning authorities increasingly want robust evidence on queue length, pass-by traffic, junction performance, walking and cycling safety, and the practical relationship between the lane, the car park, servicing, and nearby roads. If that evidence is weak, validation delays and objections tend to follow.
From our perspective, the best transport work starts early. With more than 30 years of transport engineering experience at ML Traffic, we’ve seen the same pattern again and again: schemes that succeed are usually the ones where the TA is built around the actual operating characteristics of a drive-through, not around generic restaurant assumptions.
In this guide, we set out what planning teams need to get right in 2026, from thresholds and trip generation through to queue modelling, road safety evidence, sustainable travel, and the supporting material councils usually expect to see before they’re comfortable recommending approval.
When A Drive Through Fast Food Scheme Needs A Transport Assessment
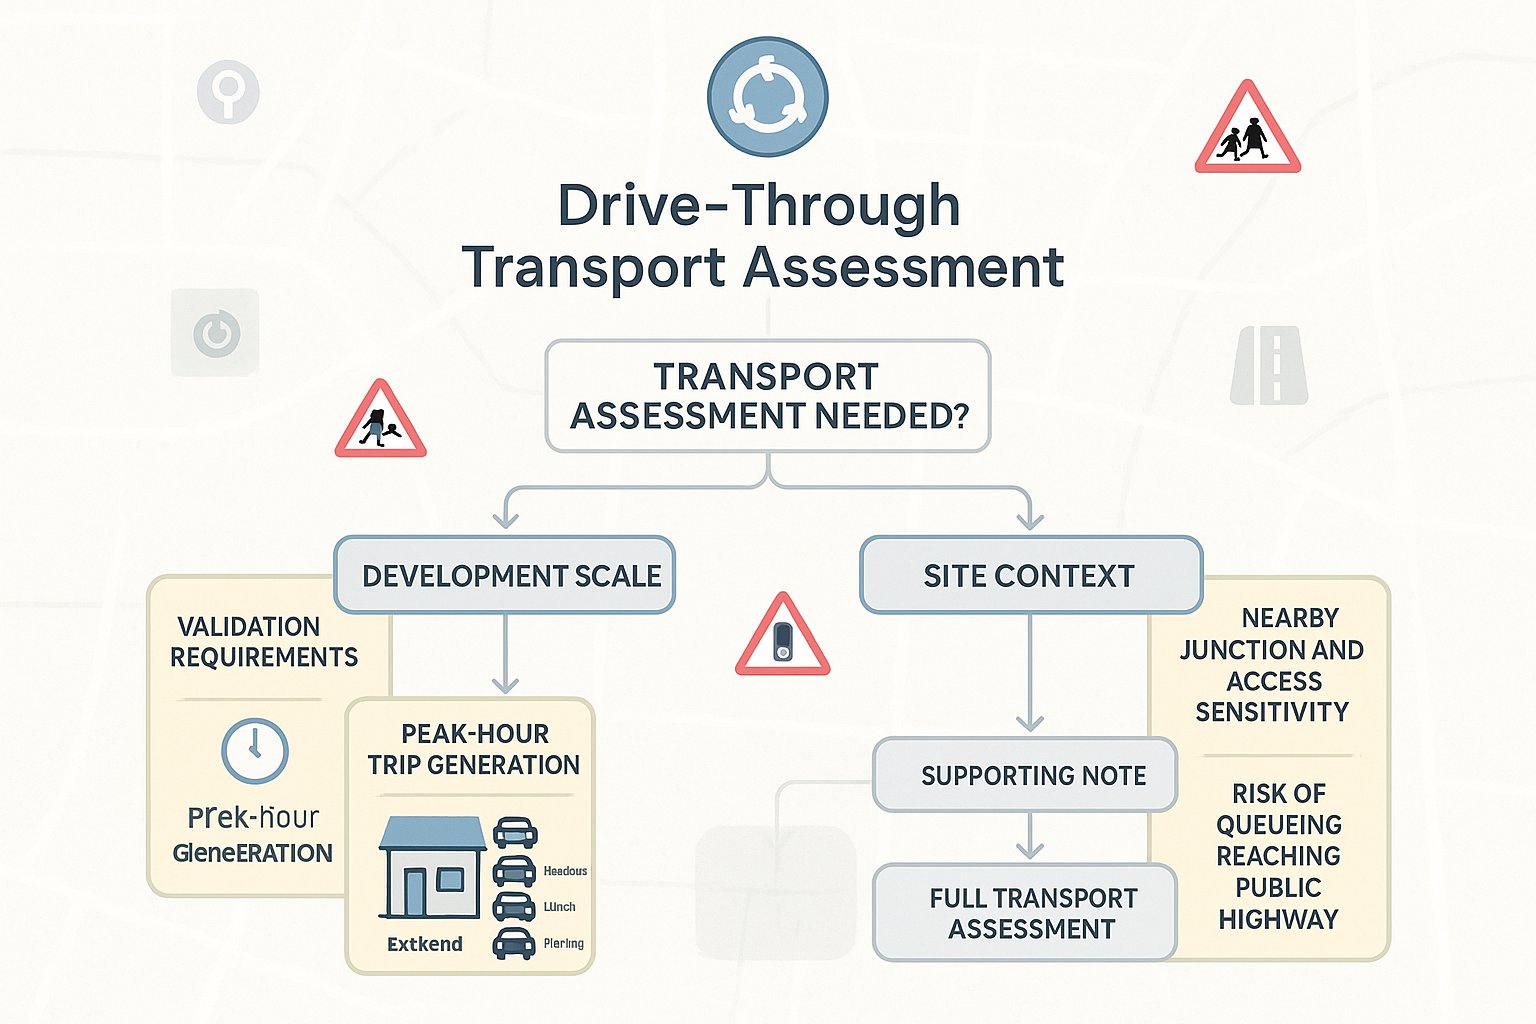
Whether a drive-through needs a full TA, a lighter Transport Statement, or supporting note depends on two things: scale and context.
In broad terms, a Transport Assessment is normally required where forecast trips are likely to have a material effect on the local highway network, or where the local authority’s validation checklist sets a threshold by floor area, peak-hour trips, parking numbers, or development type. Some councils are explicit about drive-through uses: others rely on more general thresholds and expect professional judgement.
That second point matters. A modest floor area does not automatically mean a modest transport effect. A drive-through can generate concentrated vehicular demand at breakfast, lunchtime, evening and weekends, particularly on roadside or edge-of-centre sites. So even a relatively compact building may warrant detailed assessment if it sits on a constrained corridor, near a busy roundabout, close to a school, or on a route with an existing collision history.
We usually advise teams to check four things early:
- local validation requirements:
- likely peak-hour trip generation:
- sensitivity of nearby junctions and accesses: and
- whether queueing could affect the public highway.
If any of those raise concern, a proper fast food restaurant with drive through transport assessment is generally the safer route. It gives the planning authority a structured evidence base and reduces the risk of later requests for further modelling, revised drawings, or additional surveys.
How Drive Through Development Differs From Standard Restaurant Traffic Planning
A drive-through is not just a restaurant with an extra lane. Transport-wise, it behaves differently enough that the assessment approach has to change.
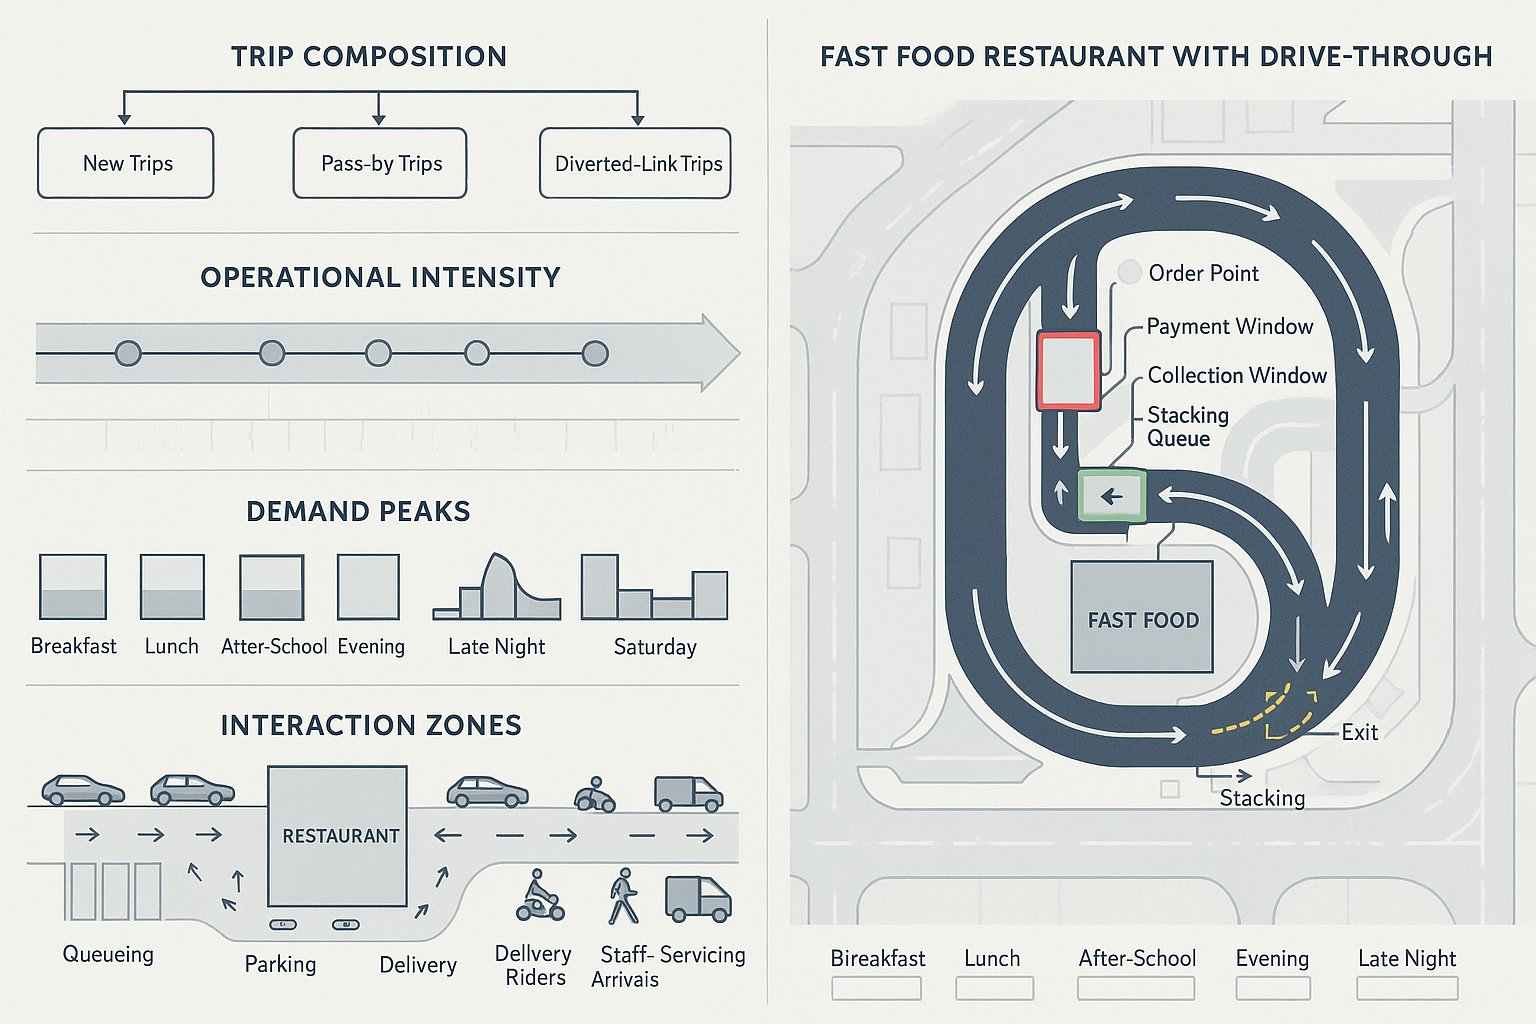
The first difference is trip composition. Drive-throughs are heavily car-dominated and often attract a large proportion of pass-by or diverted-link trips from traffic already using the surrounding road network. If we simply apply generic restaurant trip rates and load all traffic as new traffic, we can seriously overstate or misrepresent impact. On the other hand, if we assume too much pass-by traffic without evidence, the assessment loses credibility.
The second difference is operational intensity. Sit-in restaurants typically spread demand across parking, dwell time and customer turnover. Drive-throughs concentrate movement into the access, the order point, payment window and collection window. That means internal geometry, service time and stacking length become central transport issues, not side notes.
Third, trading patterns are broader. Many roadside fast food units peak at breakfast, lunch, after school, evening and late night, with Saturday often more demanding than a weekday PM peak. That is very different from some town-centre food and beverage uses.
And finally, drive-throughs create a more complex relationship between:
- lane queueing,
- car parking,
- delivery riders and click-and-collect users,
- staff arrivals, and
- servicing vehicles.
If we assess them like ordinary restaurants, problems get missed. And those are usually the problems councils focus on first.
Core Trip Generation And Mode Share Assumptions
Trip generation is the backbone of any TA, and this is where a lot of weak drive-through submissions start to unravel.
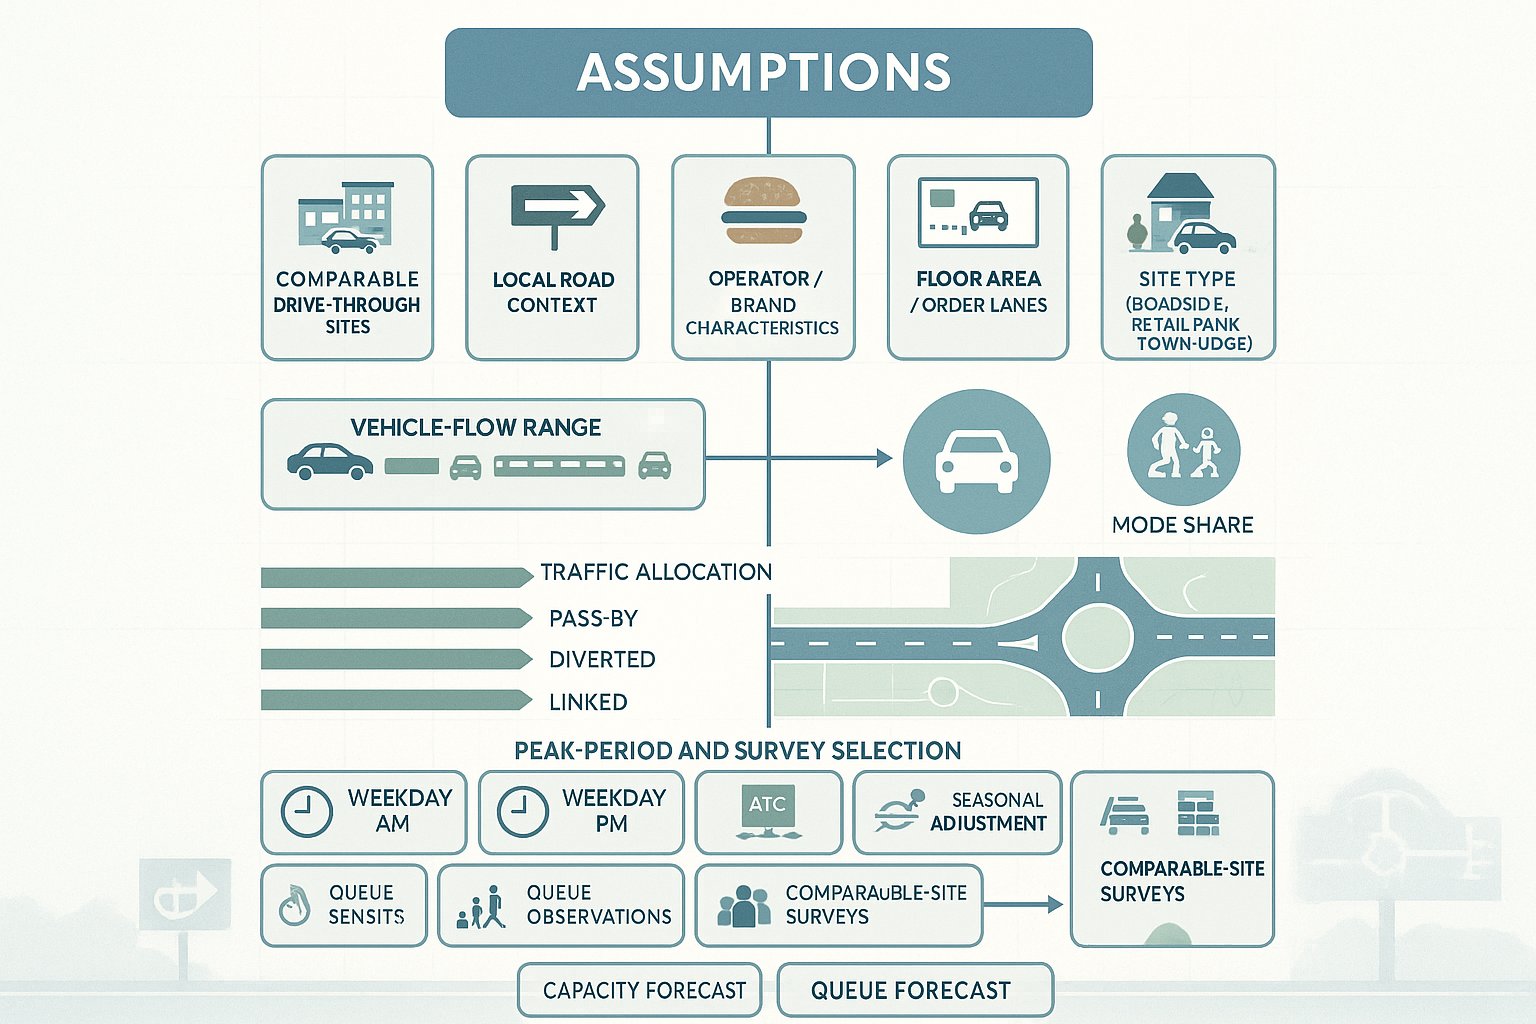
For a fast food drive-through, we should use comparable drive-through evidence wherever possible rather than generic A3/A5 or restaurant database rates. Published studies and observed site data show a very wide range of peak-hour flows, from relatively modest levels to around 12 to 190 vehicles per hour per lane in some contexts. That spread tells us something important: there is no reliable one-size-fits-all rate.
Good practice is to combine several strands of evidence:
- observed trip rates from genuinely comparable drive-through sites:
- local traffic context and roadside function:
- brand or operator trading characteristics, if available:
- floor area and number of order lanes: and
- whether the proposal is standalone, roadside, retail park-based or town-edge.
We also need to split trips properly into primary, pass-by, diverted and linked elements. If we don’t, network assignment becomes distorted and the authority may question the entire modelling approach.
Mode share should also be grounded in reality. Most drive-throughs are still predominantly car-based, especially on out-of-centre sites. But we shouldn’t assume zero active travel or public transport use. Staff travel patterns may differ from customer patterns, and some urban sites can still support walk-in trade, cycle access and bus use.
The key is balance: realistic assumptions, transparent evidence, and enough explanation that another transport officer can follow the logic without guessing what we meant.
Peak Periods, Seasonal Variation, And Robust Survey Selection
Peak-hour testing should reflect how the site will actually trade, not just the standard highway modeller’s defaults. In many cases we’ll need weekday AM, weekday PM and Saturday assessments, plus school-run sensitivity or event-related peaks where those are relevant.
Seasonality can also skew results. Holiday routes, coastal locations, retail-led destinations and student areas all behave differently at different times of year. Where demand is seasonal, we should either survey in neutral months or apply a clearly evidenced seasonal adjustment.
Survey selection matters just as much. Robust TAs often combine:
- automatic traffic counts (ATCs),
- junction turning counts,
- queue length observations,
- comparable-site drive-through surveys, and
- sometimes service-time observations for calibration.
That mix gives us a better basis for capacity modelling and queue forecasting than a single borrowed trip rate ever could.
Assessing Junction Capacity And Impact On The Local Highway Network
Once trips are established, the next question is simple: where do they go, and what do they do to the network?
A sound assessment identifies all junctions likely to experience a material change, not just the site access. Depending on location, that may include priority junctions, roundabouts, signalised nodes, internal retail park junctions, and nearby right-turn locations where inbound traffic may stack.
We would usually test:
- a baseline scenario,
- a future year without development,
- a future year with development, and
- where relevant, a scenario including committed developments.
The modelling tool should suit the junction type, for example PICADY, ARCADY or LINSIG. What matters is not the software brand but whether the assumptions are sensible and the junction list is complete.
Authorities generally want to see practical outputs: RFC, delay, queue length, reserve capacity, and commentary on whether any impact is severe in planning terms. If a junction already operates close to capacity, even a modest increase in turning traffic may justify mitigation.
That mitigation might include revised lane allocation, a ghost island right-turn lane, signal staging changes, improved lining, access relocation, or simply operational changes on site that reduce conflict. But proposed mitigation has to be tied back to the modelling.
Too many reports stop at “impact is acceptable” without showing why. A persuasive TA explains the routeing assumptions, the sensitivity tests and the consequences clearly enough that planners, highways officers and project teams all reach the same conclusion.
Drive Through Queue Modelling, Internal Circulation, And Blocking Risk
This is the section that often decides whether a drive-through application feels credible.
A site can show acceptable off-site junction performance and still fail operationally if the drive-through queue blocks parking aisles, traps servicing vehicles, or spills back to the public highway. Councils know that. So they increasingly expect queue analysis to be specific and visual, not generic.
The core test is whether the stacking length can accommodate forecast demand during busy periods, taking account of service times, order confirmation, payment and collection. We should use observed comparable-site data where possible and be honest about variability. A wet Saturday, a promotion, app collection surges or a nearby event can all change the pattern.
Useful evidence often includes:
- predicted queue lengths in average and busy conditions:
- percentile queue estimates rather than a single mean figure:
- swept paths for cars, vans and refuse vehicles:
- plan checks for conflict with parking and pedestrian routes: and
- commentary on what happens if demand exceeds expectation.
Internal circulation is just as important. Drivers need intuitive routing from access to lane, from lane to exit, and to parking if they abandon the queue. If circulation is awkward, short tempers and sudden manoeuvres follow, not ideal, obviously.
We should also look at blocking risk in reverse: can parking activity, delivery riders or waiting vehicles obstruct entry to the lane? If yes, layout changes are usually cheaper before submission than after a highway objection lands in the inbox.
Parking Demand, Pick Up Activity, And Servicing Movements
Parking at a drive-through isn’t just about counting standard bays against local standards. The actual question is whether the site can handle overlapping activity types without friction.
A typical scheme may include:
- dine-in customers,
- walk-in takeaway users,
- click-and-collect collections,
- delivery drivers waiting briefly,
- staff parking, and
- servicing vehicles.
Those functions peak differently. Delivery riders can arrive in clusters. Collection users tend to want the shortest possible stop. Staff arrivals compress around shift changes. Servicing may happen during quieter periods, or, if badly managed, exactly when the site is busiest.
That’s why parking demand should be derived from comparable operational evidence, not only from maximum parking standards. A layout can be policy-compliant on paper and still work badly in reality.
Short-stay pick-up bays near the exit or near a dedicated entrance often help reduce circulation conflict. They also stop collection traffic from using disabled bays or hovering in awkward places. For servicing, the main principles are clear: provide on-site turning where feasible, avoid reversing onto the public highway, and keep HGV/refuse routes separate from customer desire lines as far as possible.
We should show this through tracking and a concise servicing strategy. If servicing relies on staff moving cones and “managing” vehicles around a busy lane, planning officers tend to see that for what it is: a design problem disguised as an operational note.
Safe Access Design For Cars, Delivery Vehicles, Cyclists, And Pedestrians
Access design has to do more than allow vehicles in and out. It has to manage movement safely for everyone who will actually use the site.
For cars and delivery vehicles, that means suitable junction form, entry width, exit geometry, kerb radii, visibility splays and turning provision. On busier roads, a simple priority access may be fine, or completely inadequate. The context decides. Traffic speed, right-turn demand, proximity to neighbouring junctions and the potential for outbound queues all matter.
For pedestrians, the basics are still too often undercooked. People need direct routes from the frontage, parking areas and nearby footways to the entrance, without crossing the drive-through lane in odd places. Crossing points should be legible and accessible, with dropped kerbs and tactile paving where appropriate.
Cyclists deserve the same level of design thought. That includes safe site entry, low-conflict routes, and secure cycle parking near the building rather than hidden at the back behind bins and plant.
Where possible, service access should be separated from customer movement. If that isn’t achievable, then timing restrictions, clear routeing and physical design controls become more important.
A good TA explains not just that access is compliant, but that it is understandable. In practice, understandable design is often what prevents hesitation, last-minute lane changes and small conflicts that never make it into a model but do shape the real safety performance of a site.
Road Safety Evidence, Visibility, And Personal Injury Collision Review
Road safety evidence should never be a token appendix. For drive-through schemes, it’s a central part of the planning case.
We normally review at least five years of personal injury collision data on the site frontage and nearby junctions likely to be affected by development traffic. The purpose is not simply to count collisions, but to identify patterns. Were there right-turn shunt incidents? Pedestrian collisions near a crossing desire line? Cycle collisions at a roundabout entry? Those details matter because they show whether the proposal could worsen an existing issue.
Visibility also needs to be properly demonstrated. Access visibility splays should reflect measured vehicle speeds and accepted stopping-sight distance standards. It’s no use drawing idealised splays through landscaping, signage, boundary treatments or third-party land constraints that won’t actually be cleared.
A convincing road safety chapter usually includes:
- collision analysis by type and location:
- a review of highway geometry and observed behaviour:
- visibility checks for access and internal crossings:
- commentary on vulnerable road users: and
- targeted mitigation where needed.
Mitigation may be modest, lining, signing, crossing improvements, speed management, access adjustment, but it should be proportionate and evidence-led.
And yes, authorities do notice when a TA says “no significant safety issue” while the PIC data shows a pattern the report never properly addresses. That sort of mismatch can undermine confidence in the whole submission.
Active Travel, Public Transport Access, And Sustainable Travel Measures
Because drive-throughs are car-oriented, some applicants treat sustainable travel as a box-ticking exercise. That is a mistake, particularly in 2026 when planning policy scrutiny around active travel is only getting sharper.
Even on roadside sites, we should assess whether staff and some customers can realistically arrive by foot, cycle or public transport. That means looking at actual route quality, not just drawing a radius on a plan. Are there continuous footways? Safe crossings? Lit and overlooked paths? A usable bus stop in both directions? Secure cycle parking in a sensible location?
For staff in particular, sustainable travel measures can be practical and measurable. Typical commitments include:
- secure and covered cycle parking:
- staff lockers and changing provision:
- travel information packs:
- discounted public transport information or ticket support where relevant:
- delivery management measures: and
- a simple Travel Plan focused on staff mode shift.
This is also where local policy alignment matters. Councils often expect schemes to show how they support healthier streets, reduced car dependency where possible, and safe access to nearby public transport.
We don’t need to pretend a suburban drive-through will suddenly become a high-cycling destination. But we do need to show that the design does not exclude sustainable modes and that reasonable improvements have been considered. That’s a much stronger position than saying, in effect, “customers drive, hence nothing else matters.”
What Local Planning Authorities Commonly Expect In Supporting Evidence
Most local planning authorities are looking for the same core ingredients, even if their validation checklists are worded differently.
At minimum, they usually expect a transport submission to explain:
- the development proposal and operational format:
- existing site access and local highway conditions:
- walking, cycling and public transport context:
- traffic surveys and baseline conditions:
- trip generation, distribution and assignment:
- junction capacity assessment:
- drive-through queue and internal circulation analysis:
- parking and servicing strategy:
- road safety and collision review: and
- mitigation, if needed.
Presentation matters more than many applicants expect. Clear plans, readable tables, properly labelled figures and a transparent methodology can make a complex TA much easier for officers to review. If the report is difficult to follow, questions multiply.
Authorities also want policy consistency. The TA should align with the Local Plan, parking standards, design guidance and national policy themes around sustainable transport and safety. That does not mean quoting policy pages at length. It means showing that the scheme has been tested against the right transport questions.
On projects we support through ML Traffic, we find that concise, locally tailored reporting tends to perform better than generic long-form documents. Officers are not looking for padding. They are looking for confidence that the proposal has been understood, tested and, where necessary, improved before submission.
Common Mistakes That Delay Validation Or Trigger Planning Objections
Most objections to a drive-through TA are not caused by obscure technical points. They come from a fairly familiar set of mistakes.
The first is using generic restaurant trip rates instead of drive-through-specific evidence. That instantly raises doubts about every conclusion that follows.
The second is failing to assess queueing and internal blocking properly. A report may show acceptable access operation, but if it ignores lane stacking, parking conflicts or exit blockage, highway officers will usually spot the gap.
Other common problems include:
- no clear pass-by or diverted-trip allowance, or one with no evidence:
- omission of key junctions from the modelling area:
- no allowance for committed development in the future year:
- weak or absent PIC collision analysis:
- little detail on pedestrian and cycle safety:
- unrealistic servicing assumptions:
- parking layouts that don’t reflect click-and-collect or delivery activity: and
- mitigation proposals that are vague, uncosted or disconnected from the assessment.
There’s also a softer problem: inconsistency between documents. If the TA, site plan, swept path drawings and Design and Access Statement tell slightly different stories, objections become much more likely.
In our experience, the best way to avoid delay is to pressure-test the submission before it goes in. Ask the awkward questions early. Where will queues sit? Who crosses where? Can a refuse vehicle turn without conflict? Does the Saturday peak matter more than the weekday PM? That internal challenge process saves time, and usually planning risk, later.
Conclusion
A strong fast food restaurant with drive through transport assessment is not just a traffic forecast. It is a practical test of whether the scheme will work safely and efficiently in the real world.
For planning teams in 2026, the essentials are clear: use genuine drive-through trip evidence, separate pass-by and linked trips properly, assess the right peak periods, model affected junctions, prove the queue won’t block the site or the highway, and show safe movement for pedestrians, cyclists, delivery vehicles and general traffic alike.
Just as importantly, the report has to match local expectations. Councils want concise, credible evidence tied to policy, site layout and operational reality.
When that work is done well, objections become easier to answer, and often easier to avoid altogether. When it’s done badly, even a promising scheme can stall on issues that should have been identified at concept stage.
That’s why we always come back to the same principle: treat the transport assessment as part of the design process, not a late planning attachment. The results are almost always better.
Frequently Asked Questions about Fast Food Restaurant Drive Through Transport Assessments
When is a transport assessment required for a fast food restaurant with a drive-through?
A transport assessment is generally required if forecast trips materially affect the local highway network or if local validation thresholds based on floor area, peak-hour trips, or parking numbers are met. Even small drive-throughs on busy or sensitive sites may need an assessment.
How does traffic from a drive-through fast food restaurant differ from a standard restaurant?
Drive-throughs generate mostly car-borne, short-stay, pass-by, and diverted trips, with intense peak demands at breakfast, lunch, and evenings. Queueing, stacking lengths, and internal circulation are critical issues not typically seen with sit-in restaurants.
What key factors should a transport assessment for a drive-through include to satisfy local planning authorities?
It should cover trip generation using comparable drive-through data, peak period surveys including weekdays and Saturdays, detailed junction capacity modelling, queue and internal circulation analysis, parking and servicing strategies, road safety reviews, and sustainable travel measures aligned to local policies.
Why is queue modelling important in a drive-through transport assessment?
Queue modelling ensures stacking lanes can accommodate peak demand without blocking parking aisles, servicing access, or the public highway. Proper queue analysis prevents conflicts and supports safe, efficient site operation, which councils increasingly expect to be demonstrated.
How is sustainable travel considered for predominantly car-focused drive-through restaurants?
While drive-throughs are car-dominated, sustainable travel is assessed by reviewing walking, cycling, and public transport access. Measures such as secure cycle parking, pedestrian routes, bus stop proximity, and staff travel plans are included to align with transport policy and promote healthier travel modes.
What are common mistakes that cause delays or objections in drive-through transport assessments?
Mistakes include using generic restaurant trip rates instead of drive-through-specific data, ignoring queueing issues and internal blocking, omitting pass-by traffic analysis, failing to include all relevant junctions and committed developments, overlooking pedestrian and cyclist safety, and providing vague mitigation proposals.