If a planning application turns on whether a junction can cope, the discussion usually gets technical very quickly. Local authorities want evidence, not guesswork. Developers want clarity on risk, cost and mitigation. And everyone involved, planners, architects, transport consultants, solicitors and councils, needs outputs that are defensible when a scheme is scrutinised.
That is where Junctions 11 software comes in. In UK transport planning, it remains one of the standard tools for testing how priority junctions, roundabouts and simple signalised junctions are likely to perform under existing and future traffic conditions. Used properly, it helps us estimate capacity, delay, queues and operational stress in a way that can be clearly presented within a transport assessment or supporting planning submission.
In practice, though, the value of a Junctions 11 model depends less on pressing “run” and more on everything around it: traffic surveys, coding accuracy, realistic assumptions, careful checking and clear reporting. A neat output table means very little if the geometry is wrong or the turning counts have been misread.
In this guide, we set out how Junctions 11 fits into planning work in 2026, what it can model, what data it needs, how to build and check a robust model, and how to present results so they actually help a planning case rather than confuse it.
What Junctions 11 Software Is And When It Is Used
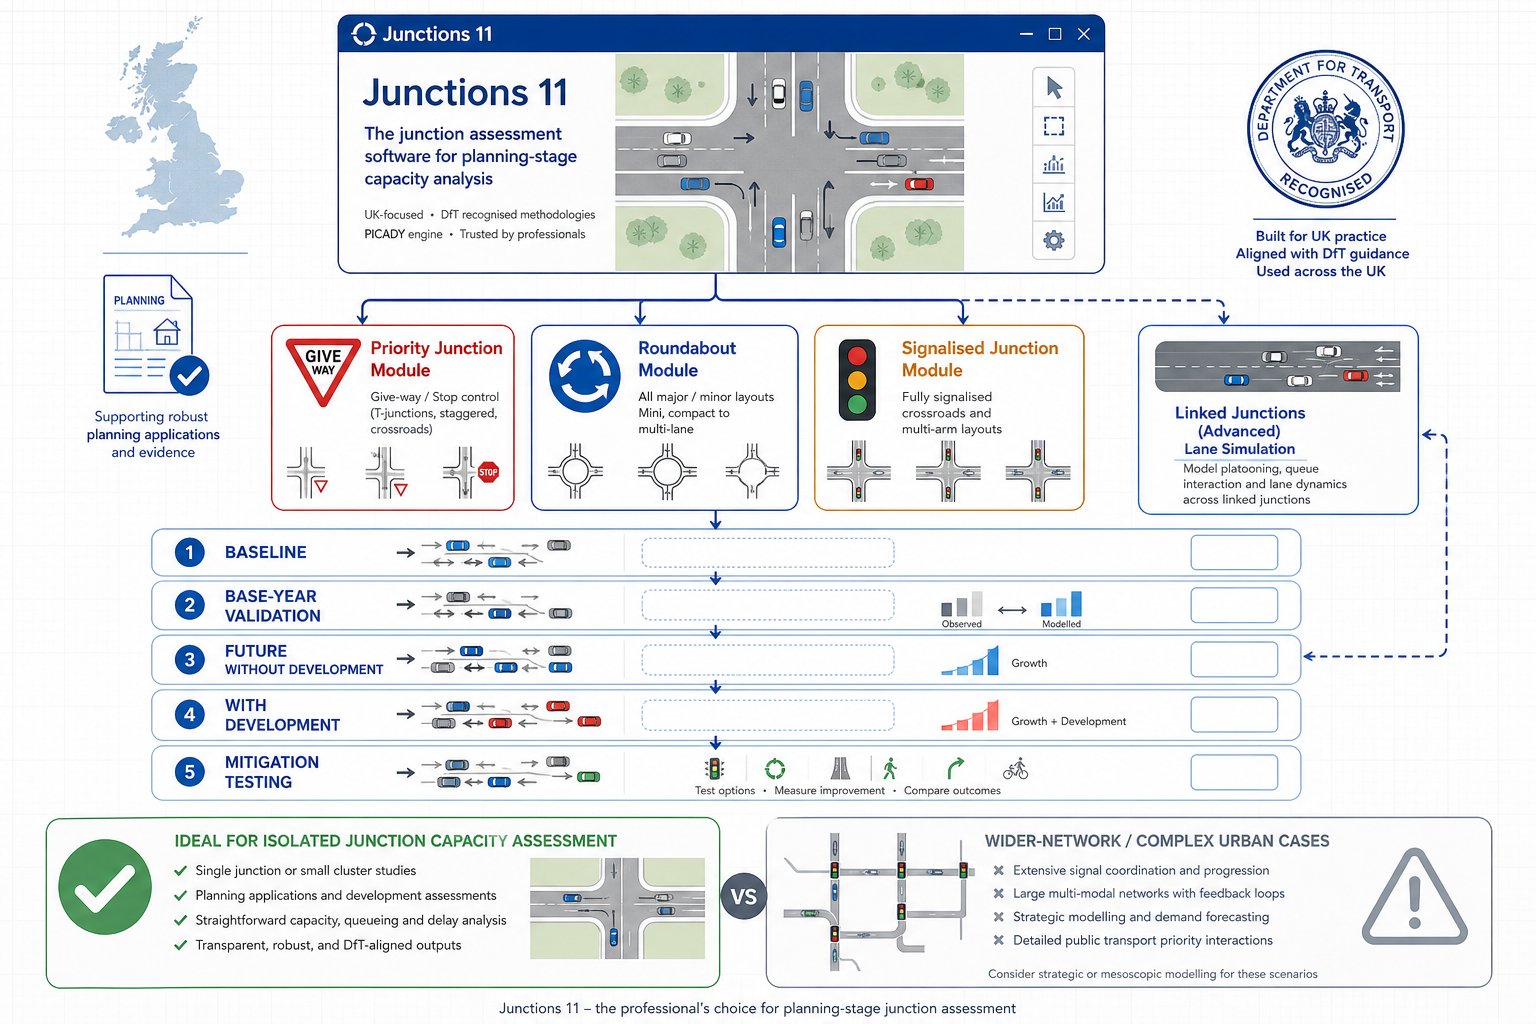
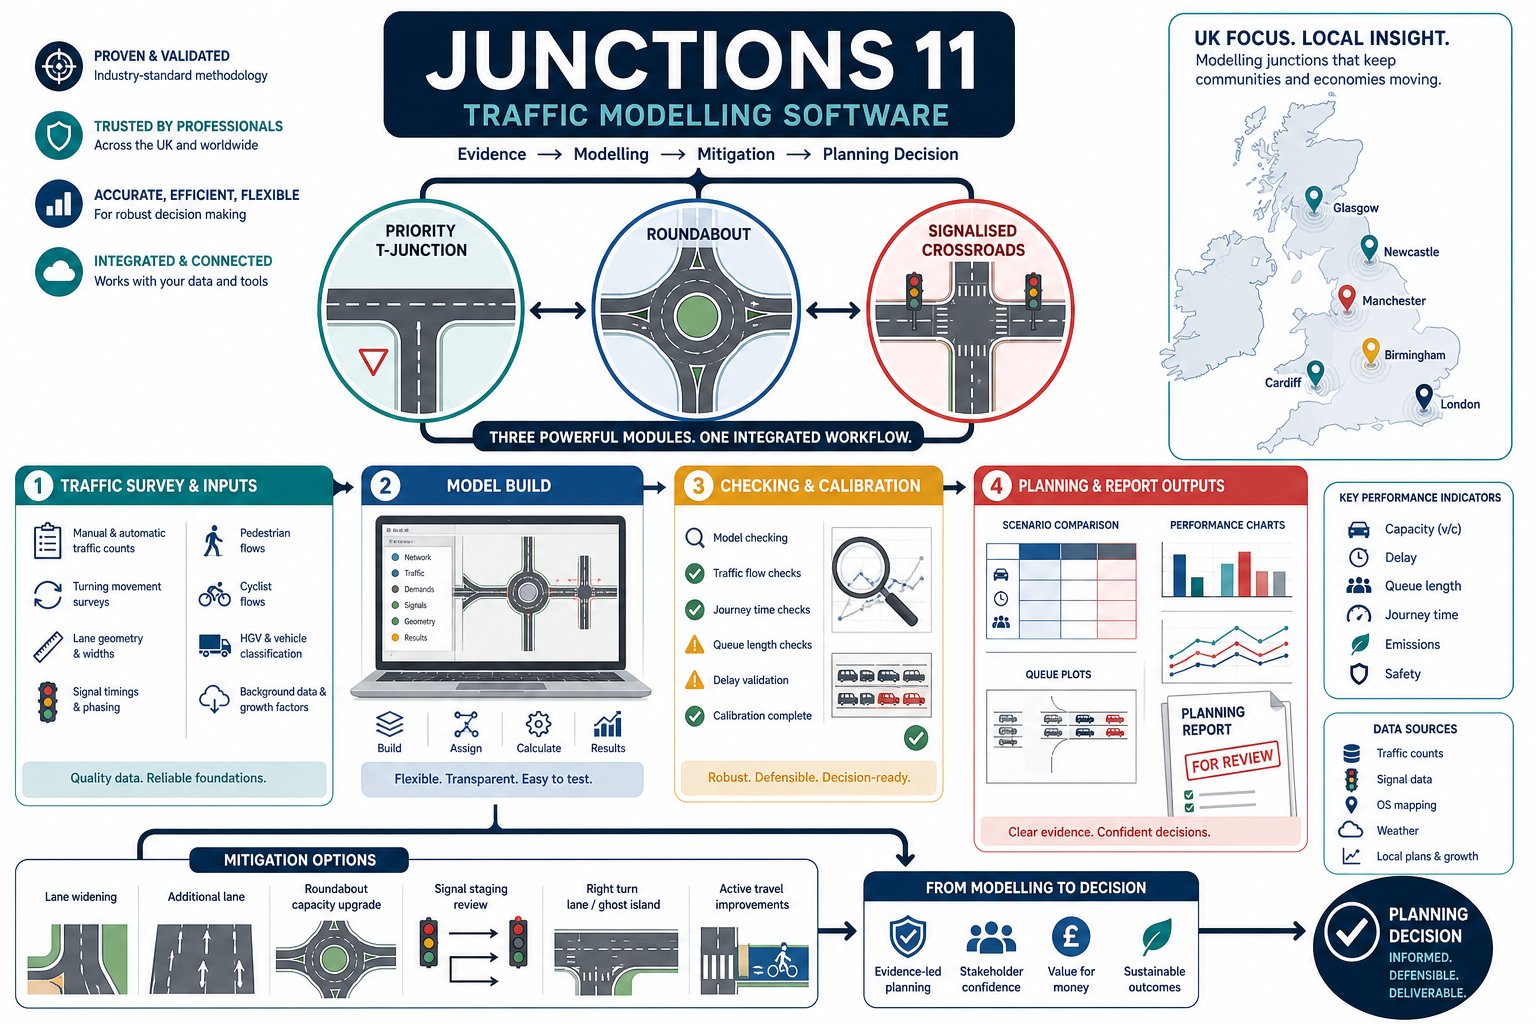
Junctions 11 software is TRL Software’s established package for modelling the performance of individual junctions and small groups of closely related junctions. In day-to-day transport work, it is widely used to assess whether a junction arrangement is likely to operate within acceptable limits once existing traffic, background growth and development traffic are taken into account.
The software brings together the core modules many practitioners already know by name: PICADY for priority junctions, ARCADY for roundabouts and OSCADY for isolated signalised junctions. It can also represent certain linked situations through lane simulation where spacing is tight enough for one junction to influence another.
We typically use it at several points in the planning process:
- to test an existing baseline using surveyed traffic flows
- to assess a base year or validation case
- to forecast future year without-development conditions
- to test with-development scenarios
- to compare mitigation options, such as lane widening, altered priorities or revised signal staging
That makes it especially relevant for transport assessments, transport statements, access appraisals and technical notes submitted with planning applications.
It is not a catch-all model for every highway question. If a site has a large urban network, complex signal coordination or wider route assignment issues, other tools may be more appropriate. But for isolated junction capacity work, which is still a large proportion of planning-related transport analysis in the UK, Junctions 11 remains the workhorse. And, frankly, planning officers and highway authorities are very used to seeing it.
How Junctions 11 Fits Into Transport Assessments And Planning Submissions
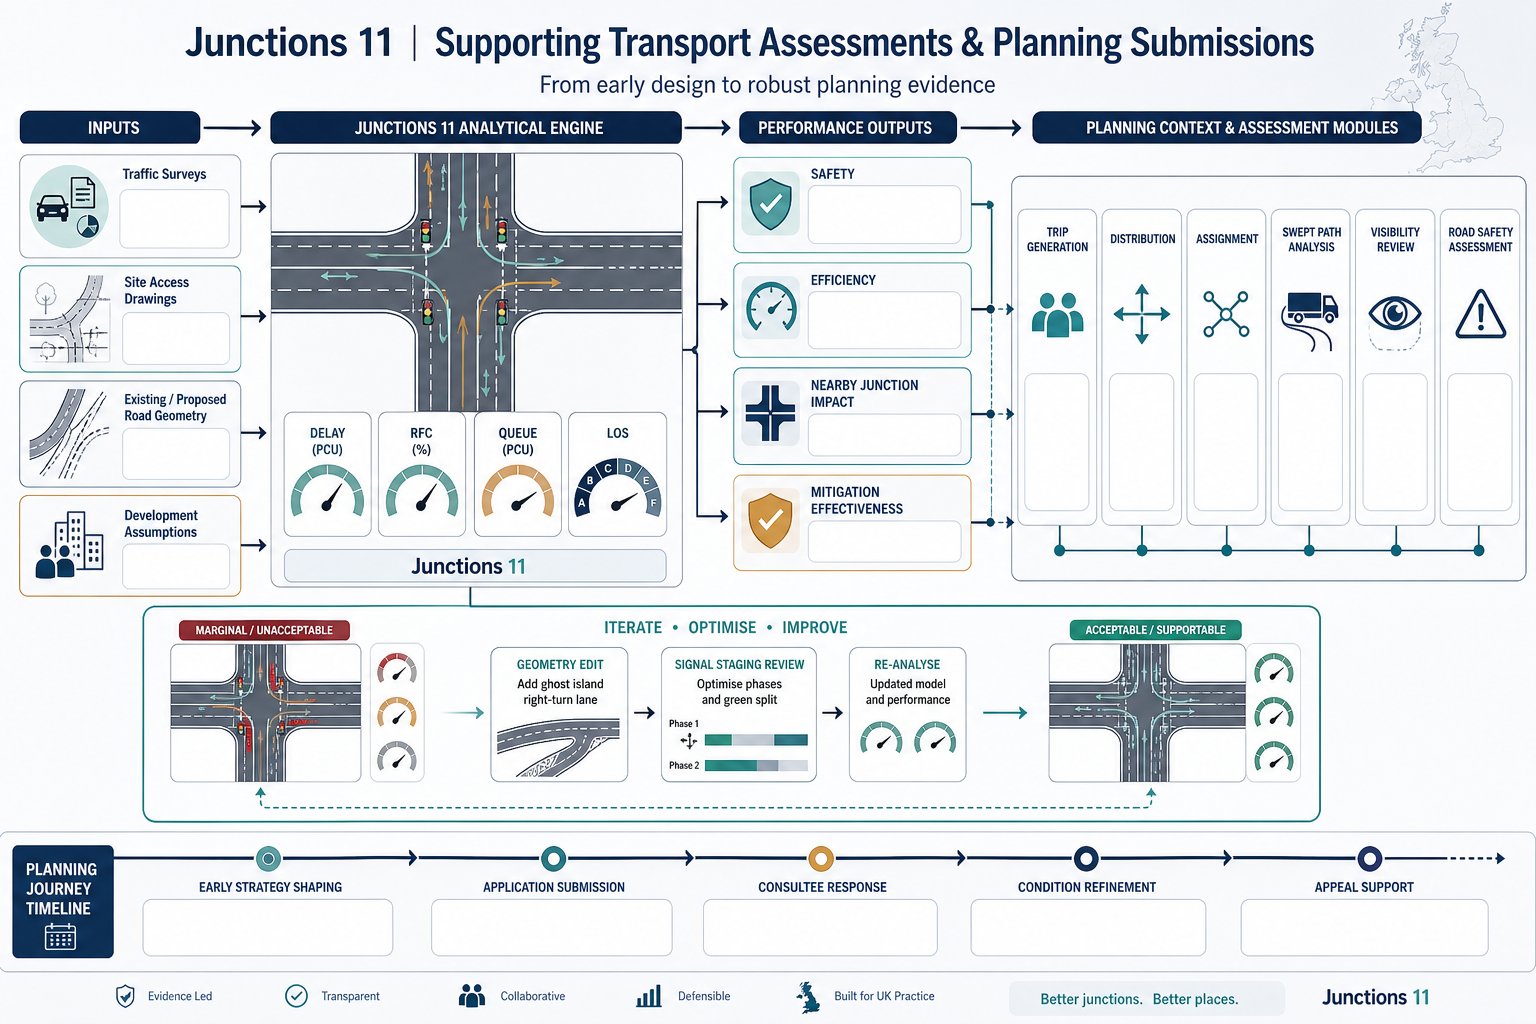
Within a planning submission, Junctions 11 usually sits at the point where design intent meets operational proof. A proposed access may look tidy on a drawing, but the authority will still want to know whether it works in traffic terms, both on opening and in the agreed future assessment year.
We use the software to turn survey data and design assumptions into measurable outputs that support a planning narrative. Those outputs often inform some of the most important questions in a transport assessment:
- Can the proposed site access operate safely and efficiently?
- Will the development materially worsen conditions at nearby junctions?
- Is mitigation required, and if so, does it solve the identified issue?
- Are residual impacts likely to be severe in planning terms?
That link to planning policy matters. Junction modelling is rarely presented in isolation: it supports a wider argument around access, highway capacity, sustainability and acceptability. The model results are hence usually paired with trip generation, distribution, assignment, swept path work, visibility analysis and sometimes road safety review.
For planning teams, timing is everything. Early modelling can shape the access strategy before an application is fixed. Later, the same modelling may be used to refine conditions, respond to consultee comments or support an appeal statement.
On live projects, we often find the most useful role of Junctions 11 is not just proving a final answer. It helps us iterate. A modest geometry change, a ghost island right-turn lane, or a revised signal stage can shift a junction from marginal to acceptable. Used that way, it becomes less of a reporting tool and more of a design tool, which is where much of its real value lies.
The Main Junction Types You Can Model In Junctions 11
Junctions 11 is designed around the junction forms most commonly encountered in UK development work. That makes it practical for planning applications, because the software aligns with the kinds of access points and nearby highway nodes that authorities expect to see assessed.
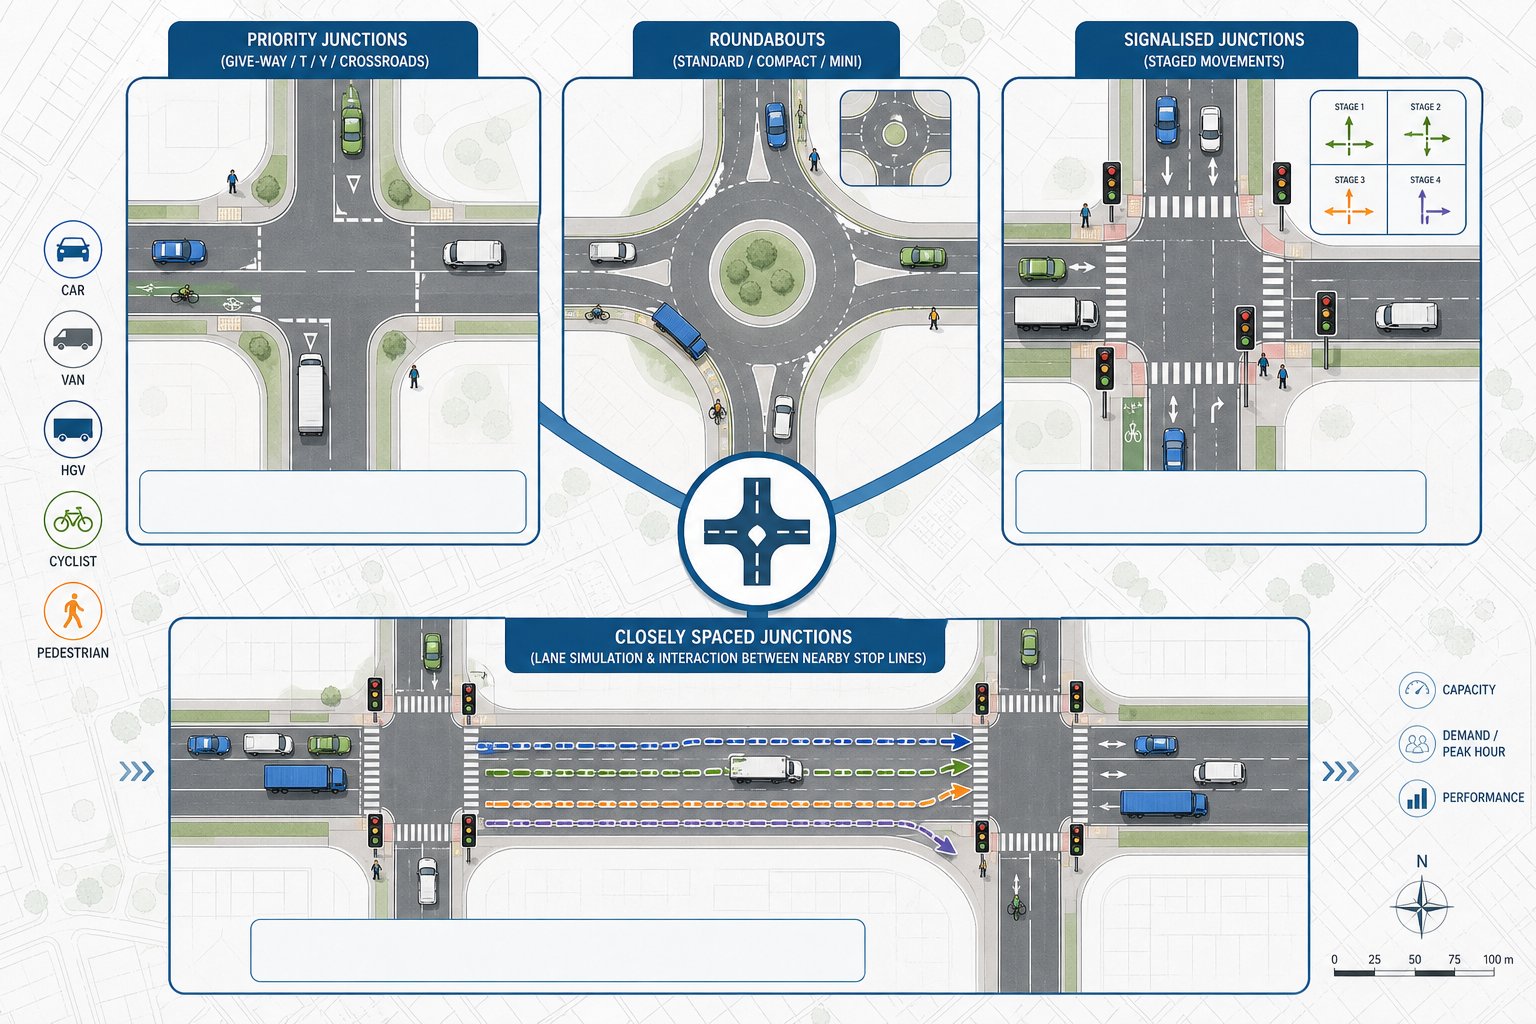
At a high level, it covers priority junctions, roundabouts and simple signalised junctions, with additional scope for linked behaviour in certain closely spaced arrangements. The right choice of module matters, because each is based on a different operational logic and set of inputs.
For development work, this usually means we select the module that best reflects the real control type, then build scenarios around existing operation, forecast demand and any physical mitigation. If the wrong modelling approach is chosen at the outset, every output that follows becomes harder to defend.
Priority, Roundabout, And Signalised Junction Capabilities
For priority junctions, the PICADY module is commonly used for T-junctions, Y-junctions and crossroads where minor-arm traffic gives way to a major road. It can account for features such as right-turn lanes and other layout characteristics that materially affect capacity.
For roundabouts, ARCADY covers conventional roundabouts, compact forms and mini-roundabouts, along with some non-standard arrangements. That makes it highly relevant for residential, mixed-use and roadside development where roundabout access remains common.
For signalised junctions, OSCADY is used for isolated traffic signals with multiple stages and phases. It can represent pedestrian stages and straightforward adaptive-style arrangements where appropriate.
Where junctions sit close together, Lane Simulation Mode can be used to capture interaction between them. This is useful when queueing at one stop line affects another nearby movement, something a simple isolated model can miss.
Pedestrian, Cycle, And Multi-Modal Considerations
Although Junctions 11 is primarily a junction capacity tool for vehicular operation, it is not blind to non-car movements. Pedestrian crossings can be coded on approaches, which is important because crossing demands and signal stages can reduce effective green time or otherwise influence junction performance.
Cyclists are a more nuanced issue. In practice, cycle flows are often represented in a way that reflects their operational effect where they materially influence capacity, particularly at give-way conditions or signals. The exact treatment depends on the site, the volume of movements and the purpose of the assessment.
Vehicle composition also matters. The software allows for different vehicle classes, including HGVs, which is often crucial on commercial, industrial or roadside schemes. A junction serving vans and articulated vehicles will not behave quite like one serving mainly commuter cars.
So while Junctions 11 is not a full multimodal microsimulation package, it can still support a realistic planning assessment where pedestrians, cyclists and heavier vehicles have a meaningful bearing on how the junction performs.
The Input Data You Need Before Building A Model
Good junction modelling starts long before the software opens. The quality of a Junctions 11 assessment depends on whether the inputs genuinely reflect what is happening on the ground and what is likely to happen once a development is built.
In planning work, the most defensible models are usually the ones built from a disciplined evidence base: current traffic surveys, reliable geometry, agreed forecast assumptions and a clear record of how each scenario has been assembled. Skip that discipline and the model may still produce numbers, just not numbers anyone should rely on.
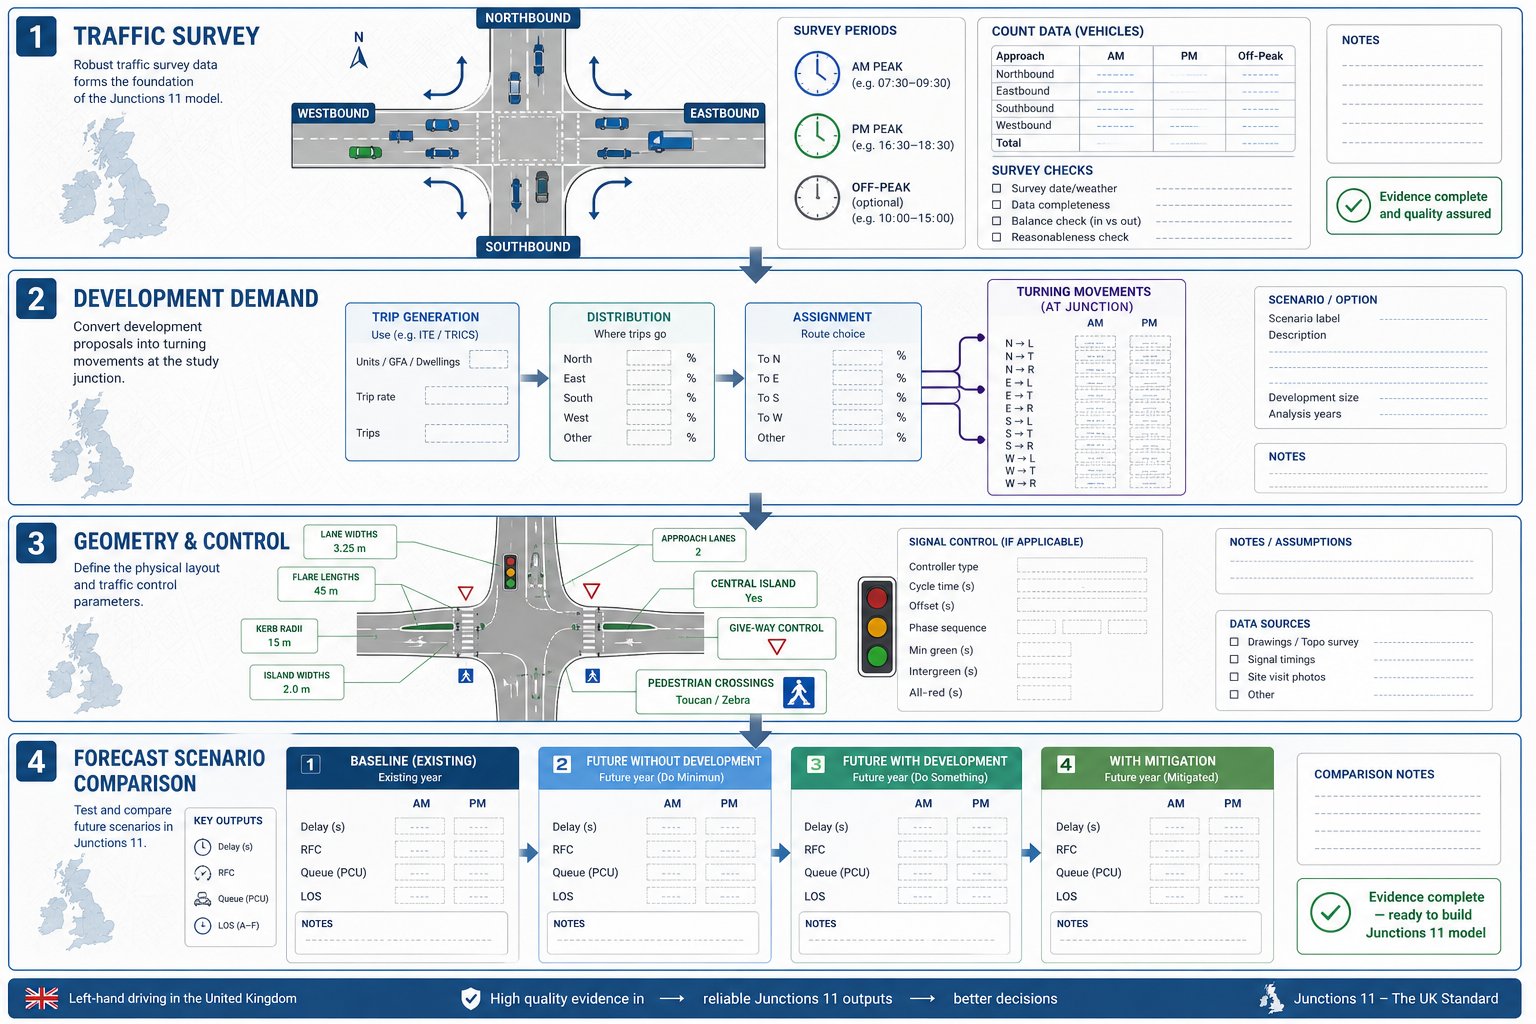
Traffic Counts, Turning Movements, And Peak Hours
The core traffic input is normally a turning-movement count for each arm and each movement through the modelled junction. In most planning assessments, we use the AM and PM peak hours, and sometimes an inter-peak or Saturday peak where the land use demands it.
This sounds straightforward, but it is where many problems begin. We need to confirm:
- survey dates and whether they are representative
- whether flows are recorded in suitable time slices
- whether all turning totals reconcile properly
- whether unusual conditions affected the count, such as roadworks, school holidays or severe weather
For some sites, a single peak hour is not enough. Retail, leisure, roadside and education schemes can generate patterns that differ from standard commuter peaks. In those cases, the model should reflect the operational period that genuinely matters, not just the easiest period to analyse.
We also need development traffic in a usable form: trip generation, distribution and assignment translated into turning flows by scenario. If that handoff is sloppy, the junction model inherits the error immediately.
Geometry, Control Data, And Forecast Scenarios
Beyond traffic, geometry is the backbone of the model. We need accurate details for entry widths, flare lengths, lane allocations, radii, island dimensions, gradients and other physical features relevant to the junction type. A seemingly minor coding error, half a metre of width missed, a flare omitted, a lane misallocated, can noticeably change the reported capacity.
Control data matters just as much. For priority junctions, that includes give-way relationships and lane use. For signalised junctions, it includes stage structure, phase timings, cycle times, intergreens, pedestrian stages and, where relevant, offsets.
Then come the forecast scenarios. A planning assessment usually requires a clear set of cases, such as:
- existing baseline
- future year without development
- future year with development
- future year with development plus mitigation
Those scenarios should be internally consistent. Background growth factors, committed development assumptions and proposed layout changes need to be applied transparently and in the same way across the comparison set. If the forecast structure is messy, the final reporting becomes messy too.
How To Build, Check, And Calibrate A Junctions 11 Model
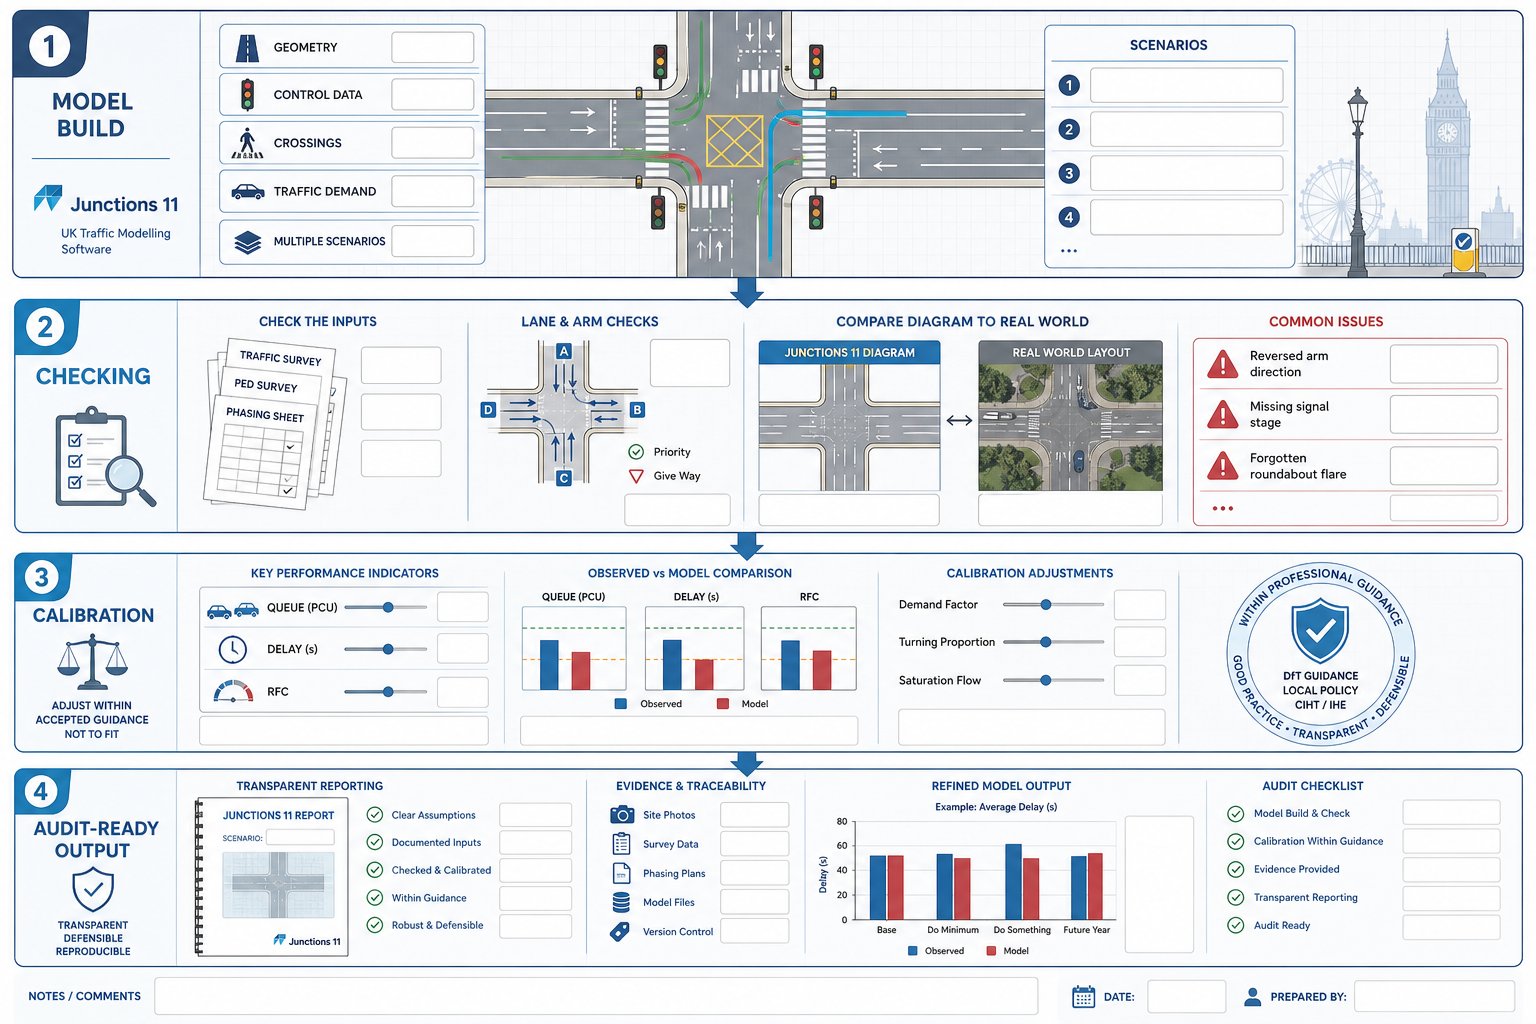
Once the evidence base is ready, the actual build process is fairly methodical. We define the correct junction type, code the geometry and control data, enter pedestrian or crossing information where relevant, add traffic demand and then run the model for each scenario.
But building the model is the easy part. The real professional work lies in checking and, where justified, calibrating it.
A robust checking process usually includes:
- confirming arm labels match the drawing and report tables
- checking movement flows against survey sheets and assignment outputs
- reviewing lane allocations and priority relationships
- ensuring scenario naming is consistent and unambiguous
- sense-checking whether outputs look plausible in relation to observed conditions
We have all seen models that are technically complete but obviously wrong on inspection: an arm coded in the wrong direction, a signal stage omitted, a roundabout flare forgotten. Those mistakes often survive because nobody stops to compare the software diagram with the actual junction layout.
Calibration is more delicate. Where observed queueing, delays or known operational behaviour exist, it may be reasonable to adjust certain model parameters within accepted guidance so the model better reflects local reality. The key phrase there is within accepted guidance. Calibration should not become a way of forcing the software to produce a politically convenient answer.
Any adjustment should be justified, proportionate and recorded clearly in the report. What was changed? Why? What evidence supported it? Could the same conclusion be reached without the adjustment? Highway authorities are usually far more comfortable with a modest, transparent calibration than with a model that appears to have been “massaged” in the dark.
In practical planning work, we find the best models are not the most complicated. They are the clearest, best checked and easiest to audit.
Understanding Key Outputs Such As RFC, Delay, Queue, And LOS
Junctions 11 produces a lot of numbers, but planning decisions usually turn on a handful of headline outputs. If those are misunderstood, the reporting can become either alarmist or oddly complacent.
The most commonly cited measure is RFC, Ratio of Flow to Capacity. In simple terms, it shows how hard a movement or arm is working relative to its theoretical capacity. As RFC rises towards 1.00, the junction is operating under greater stress. In many UK assessments, values above about 0.85 to 0.90 trigger closer scrutiny because they suggest limited spare capacity and a greater risk of unstable operation.
Delay is the average delay experienced by vehicles, usually presented in seconds per vehicle. For planners and clients, delay is often easier to grasp than RFC because it translates operational stress into something tangible: how long people are likely to wait.
Queue is equally important, especially where storage lengths, blocking back or interaction with nearby accesses are relevant. Mean queues can be useful, but maximum or percentile-style interpretations often matter more in design conversations because they help answer the obvious question: will the queue physically fit?
LOS, Level of Service, provides a qualitative shorthand derived from delay bands. It can be helpful in summaries, but we should treat it as a supporting label, not the analysis itself.
The key is context. A slightly elevated RFC at one arm may be acceptable if queues remain contained and impacts are minor. Equally, a tolerable average delay can still conceal a problematic peak queue. Good reporting reads these outputs together rather than relying on a single metric to tell the whole story.
Common Errors That Can Undermine Results
Most weak junction assessments do not fail because the software is incapable. They fail because the inputs, assumptions or reporting chain contain avoidable errors.
One of the most common issues is incorrect turning data. Totals may not reconcile, movements may be assigned to the wrong arm, or development traffic may be added twice. A close second is mis-coded geometry: wrong entry widths, missing flares, incorrect lane use or an oversimplified layout that does not match the drawing.
Signal models introduce their own risks. If stage sequences, intergreens, pedestrian stages or cycle times are entered incorrectly, the outputs can look polished while being fundamentally misleading.
Another recurring problem is inconsistent scenarios. We sometimes see a future-year baseline built using one growth assumption, then a with-development case built using another, or a mitigation case that quietly changes more than the proposed layout. That kind of inconsistency makes comparison unreliable and can quickly undermine confidence with the local highway authority.
There is also a softer error, but an important one: over-claiming certainty. Junctions 11 is a powerful tool, not an oracle. It is based on assumptions, observed data and model structure. When a report presents outputs as if they are exact predictions rather than informed estimates, readers with experience tend to spot the overreach immediately.
The cure is not glamorous. Check the surveys. Check the drawings. Check the scenario logic. Then have someone else check them again. In transport planning, a careful second review often saves far more time than a fast first submission.
How To Present Junctions 11 Results Clearly In A Planning Report
Even a sound model can lose its value if the reporting is hard to follow. Planning reports need to be clear enough for technical consultees, but also readable for case officers, applicants and, sometimes, inquiry participants who are not transport specialists.
The best approach is usually simple and structured.
Start with a plan of each modelled junction showing arm labels that match the software outputs exactly. If the drawing calls an approach “Arm B” but the table calls it “Eastbound Minor Arm”, confusion is almost guaranteed.
Next, explain the methodology briefly but properly: survey dates, peak periods assessed, forecast years, background growth, committed development assumptions, development traffic, and any calibration or capacity adjustments. This is the part that makes the results auditable.
Then present the outputs in tables that allow direct comparison across scenarios. For each relevant arm or junction, it is usually helpful to include:
- RFC
- average delay in seconds
- queue length in vehicles or PCUs
- LOS, where used
Highlight the metrics that matter, but do not bury awkward results. A transparent note explaining that one arm is forecast to operate near capacity, and that a mitigation drawing addresses it, is far more credible than a table designed to distract.
Including extracts from the Junctions 11 summary reports can also help, especially where the authority expects to see the source output. But raw appendices should support the narrative, not replace it.
From our perspective at ML Traffic, the strongest planning reports are concise, traceable and honest about the operational picture. They answer the authority’s likely questions before those questions are asked. That, more than page count, is what tends to move an application along.
Conclusion
Junctions 11 software remains a central tool for UK transport assessments because it does something planning work badly needs: it turns junction design and traffic evidence into testable, reportable outcomes. Used well, it helps us assess baseline performance, future stress, and the practical value of mitigation in a way local authorities can review with confidence.
But software alone is never the whole story. Reliable results depend on representative traffic data, accurate coding, sensible forecast assumptions, disciplined checking and reporting that is clear enough to withstand scrutiny.
For architects, planners, developers, councils and legal teams, the takeaway is fairly straightforward. A Junctions 11 model is most useful when it is treated as part of a wider planning evidence base, not as a standalone technical appendix wheeled in at the end.
If the modelling is proportionate, transparent and tied closely to the design and planning case, it can make the difference between a junction debate that drags on for months and one that is resolved on the evidence.
Frequently Asked Questions about Junctions 11 Software
What is Junctions 11 software used for in UK transport planning?
Junctions 11 is TRL Software’s standard tool for modelling priority junctions, roundabouts, and simple signalised junctions to assess capacity, queues, and delays, supporting planning applications and transport assessments with robust traffic performance data.
Which junction types can Junctions 11 model effectively?
Junctions 11 models priority junctions using PICADY, roundabouts via ARCADY, and isolated signalised junctions through OSCADY. It also can simulate linked junctions closely spaced using Lane Simulation Mode, covering most UK development junction scenarios.
What input data is necessary to build a reliable Junctions 11 model?
A reliable model requires accurate traffic surveys with turning movements for peak hours, detailed geometry including entry widths and lane allocations, control data like priorities or signal timings, plus consistent forecast scenarios reflecting development and background growth.
How does Junctions 11 incorporate pedestrian and cycle considerations?
The software includes pedestrian crossings in its capacity calculations by coding crossings on approaches, affecting green time. Cycle flows are represented if they materially impact junction capacity, often coded as vehicles, supporting a realistic multimodal assessment.
What key outputs does Junctions 11 provide and how are they used?
Key outputs include RFC (Ratio of Flow to Capacity) indicating saturation, average delay per vehicle, queue lengths, and LOS (Level of Service). These inform whether junctions operate within acceptable limits and help support planning decisions and mitigation design.
How should Junctions 11 results be presented in planning reports?
Results should be presented clearly with junction plans that match model arm labels, tables showing RFC, delay, queue, and LOS for each scenario and arm, with transparent methodology, calibration details, and summary report extracts to ensure auditability and clarity for planning authorities.