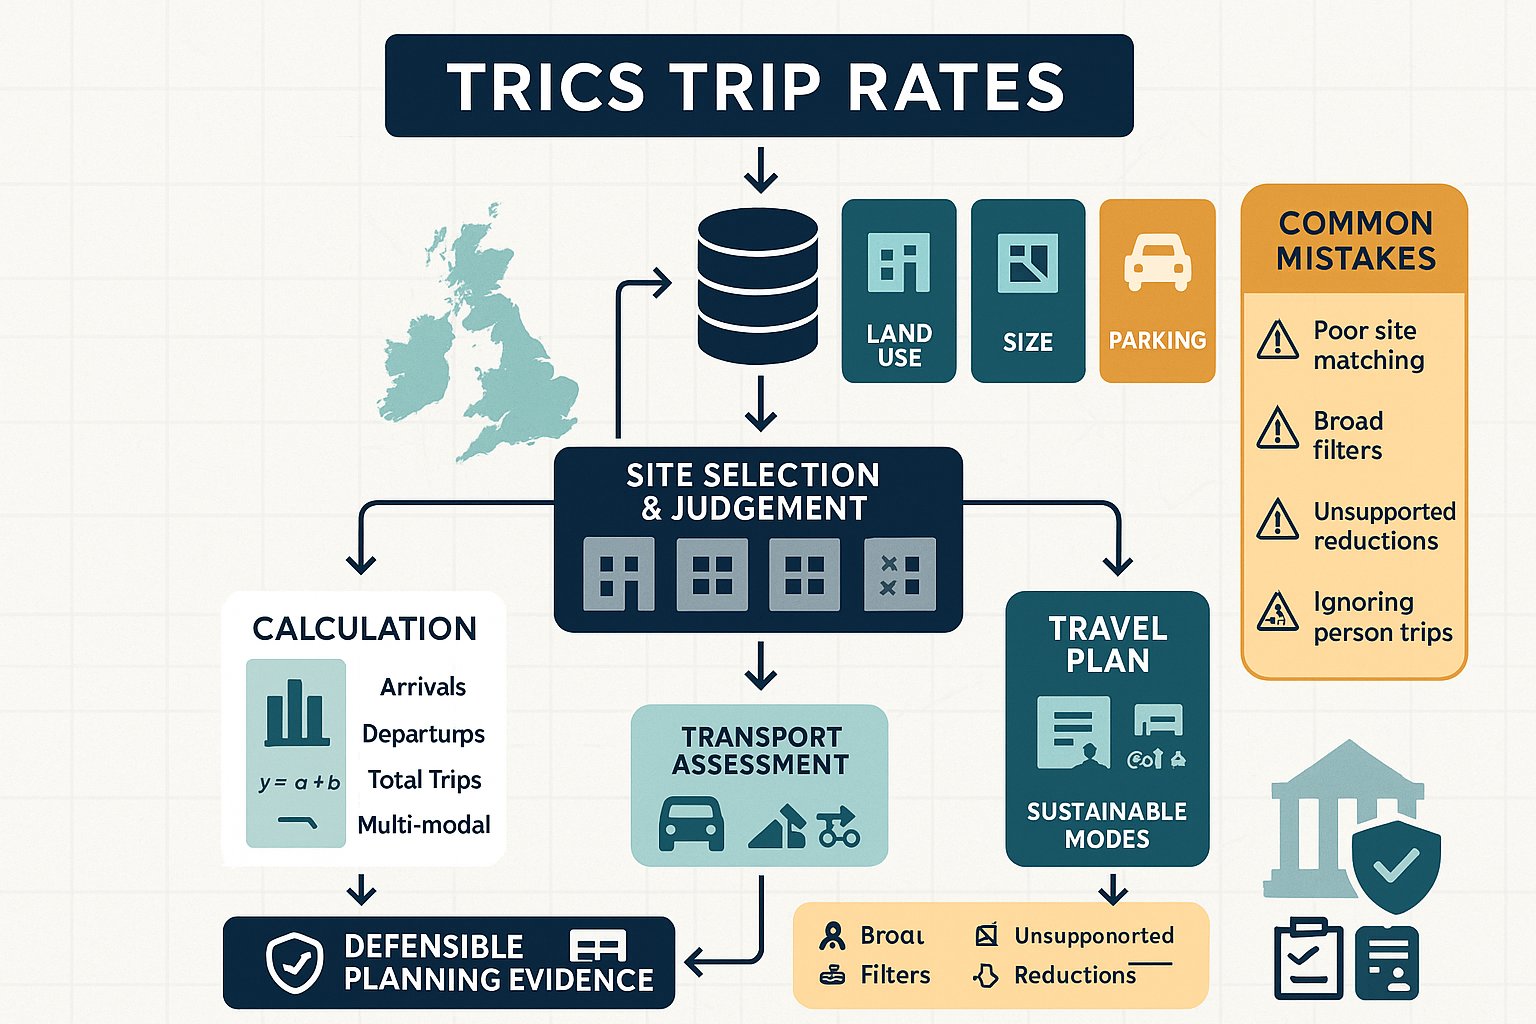
If you work anywhere near a UK planning application, you’ve probably seen TRICS trip rates quoted as if they settle the matter. Sometimes they do. Sometimes they really don’t.
That’s the thing: TRICS trip rates are hugely important, but they’re only as reliable as the judgement behind them. A well-built trip rate assessment can help a planning authority understand likely traffic impact, justify access proposals, support a Travel Plan, and keep a scheme moving. A weak one tends to attract exactly the opposite, extra queries, challenges from highways officers, and delays that nobody wants.
In our world of transport planning, we use TRICS because it remains the accepted evidence base for forecasting trips from development across the UK and Ireland. It gives us observed survey data from comparable sites, broken down by land use, time period and, increasingly importantly, mode. But “comparable” is doing a lot of heavy lifting there. Selecting the right sites, the right filters and the right assumptions is where defensible analysis is made or lost.
In this guide, we explain what TRICS trip rates actually are, how they support Transport Assessments and Statements, how to calculate them properly, where applicants often go wrong, and when extra evidence is needed. For architects, planners, lawyers, developers and councils alike, getting this right matters because trip generation is rarely just a technical appendix, it often shapes the whole planning conversation.
What TRICS Trip Rates Are And Why They Matter In Development Planning
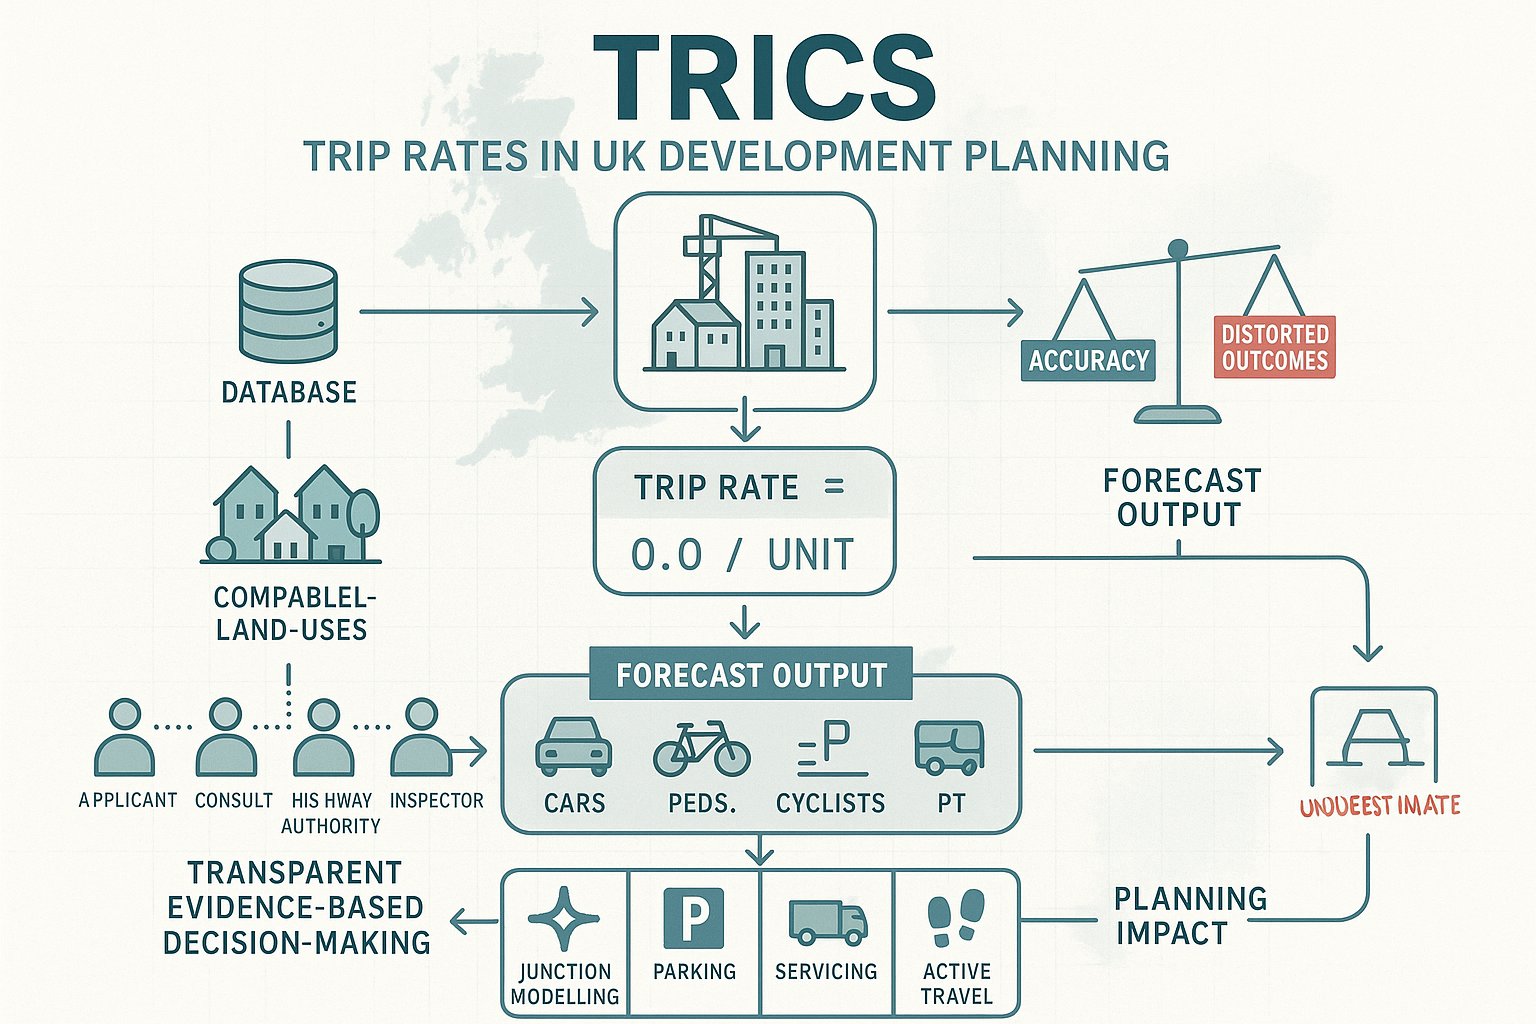
TRICS stands for the Trip Rate Information Computer System. In practice, it’s the industry-standard database used across the UK and Ireland to estimate how many trips a proposed development is likely to generate. That includes not just cars, but potentially pedestrians, cyclists, public transport users and person trips more broadly.
A trip rate is simply an observed rate of movement associated with a certain land use over a defined time period. For example, a residential scheme might generate a certain number of vehicle arrivals and departures per dwelling during the AM peak hour. An office scheme might be assessed per 100 m² gross floor area. The principle is straightforward: take robust survey evidence from comparable sites, derive a rate per unit, and apply that rate to the proposed development.
Why does it matter so much? Because trip generation sits at the heart of transport planning evidence. If the forecast is too high, a scheme can appear to create impacts it may never produce. If it’s too low, the assessment risks challenge and loss of credibility. Either way, poor trip rate work can distort junction modelling, parking strategy, servicing assumptions, active travel analysis and mitigation design.
Used correctly, TRICS trip rates give everyone a common language. Applicants, consultants, local highway authorities and inspectors can interrogate the same evidence base and test assumptions transparently. That’s one reason they remain so central to development planning in 2026.
How TRICS Data Supports Transport Assessments, Statements, And Travel Planning
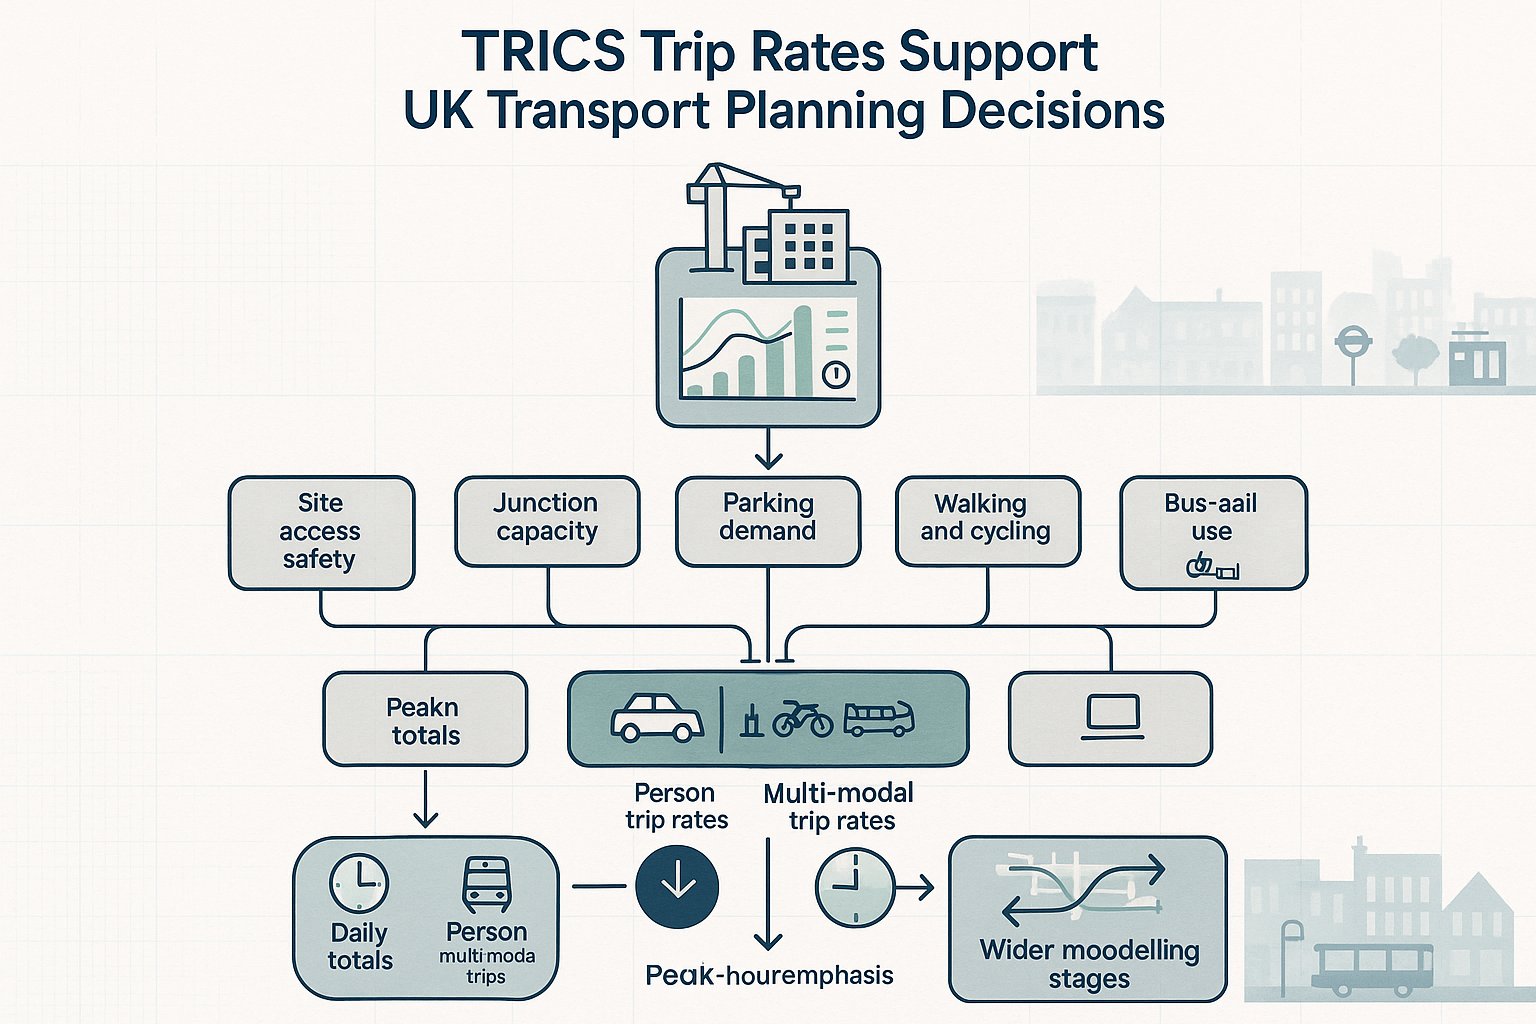
TRICS data underpins much of the quantitative case in a Transport Assessment, Transport Statement or Travel Plan. Once we know the likely trip generation of a scheme, we can start testing practical questions: Will the site access operate safely? Is a junction capacity assessment needed? How much parking is reasonable? What level of walking, cycling or public transport use should we expect? And what mitigation, if any, is proportionate?
For smaller developments, trip rates may be enough to show that transport effects are limited and can be accommodated without major intervention. For larger or more sensitive sites, they often form the first stage of a wider modelling process, feeding into assignment, distribution, capacity testing and cumulative assessment.
TRICS is also useful because it supports multi-modal forecasting. That matters more than ever. Local authorities increasingly want evidence that looks beyond vehicle traffic alone, especially where policy promotes sustainable travel, reduced parking, town-centre living or transit-oriented development. A decent assessment should reflect that reality.
What A Trip Rate Actually Measures
A trip rate measures the rate at which a particular land use generates movements over a defined period, expressed against a development unit. That unit might be a dwelling, a bedroom, a pupil place, a hotel room, 100 m² GFA, or another relevant scale parameter.
The time period is just as important as the unit. Some assessments focus on daily totals. Others focus on weekday AM and PM network peaks, school peaks, Saturday retail peaks, or bespoke periods driven by local conditions. TRICS survey data lets us review arrivals, departures and totals across different intervals so we can align the analysis with the actual planning issue.
It’s worth saying this plainly: a trip rate is not a universal truth. It’s an evidence-based estimate drawn from selected comparison sites. Its usefulness depends on whether those sites genuinely reflect the proposal in front of us.
Vehicle, Person, Multi-Modal, And Peak-Hour Trip Rates
Vehicle trip rates are still the most familiar output, and often the starting point for highway impact work. They can cover total vehicles or, in some cases, be considered by vehicle class where relevant to servicing or freight-heavy uses.
But person and multi-modal trip rates are often just as valuable. They allow us to estimate how many people will travel to and from a site by walking, cycling, bus, rail, car driver or car passenger. That’s critical when preparing or justifying a Travel Plan, assessing accessibility, or responding to policies that prioritise sustainable movement.
Peak-hour rates deserve particular care. A development may have modest daily traffic but a pronounced peak in one direction during a sensitive network hour. Equally, some uses spread trips more evenly and create less operational stress than the daily total suggests. Good analysis looks at the pattern, not just the headline number.
How TRICS Sites Are Selected To Build A Robust Database Comparison
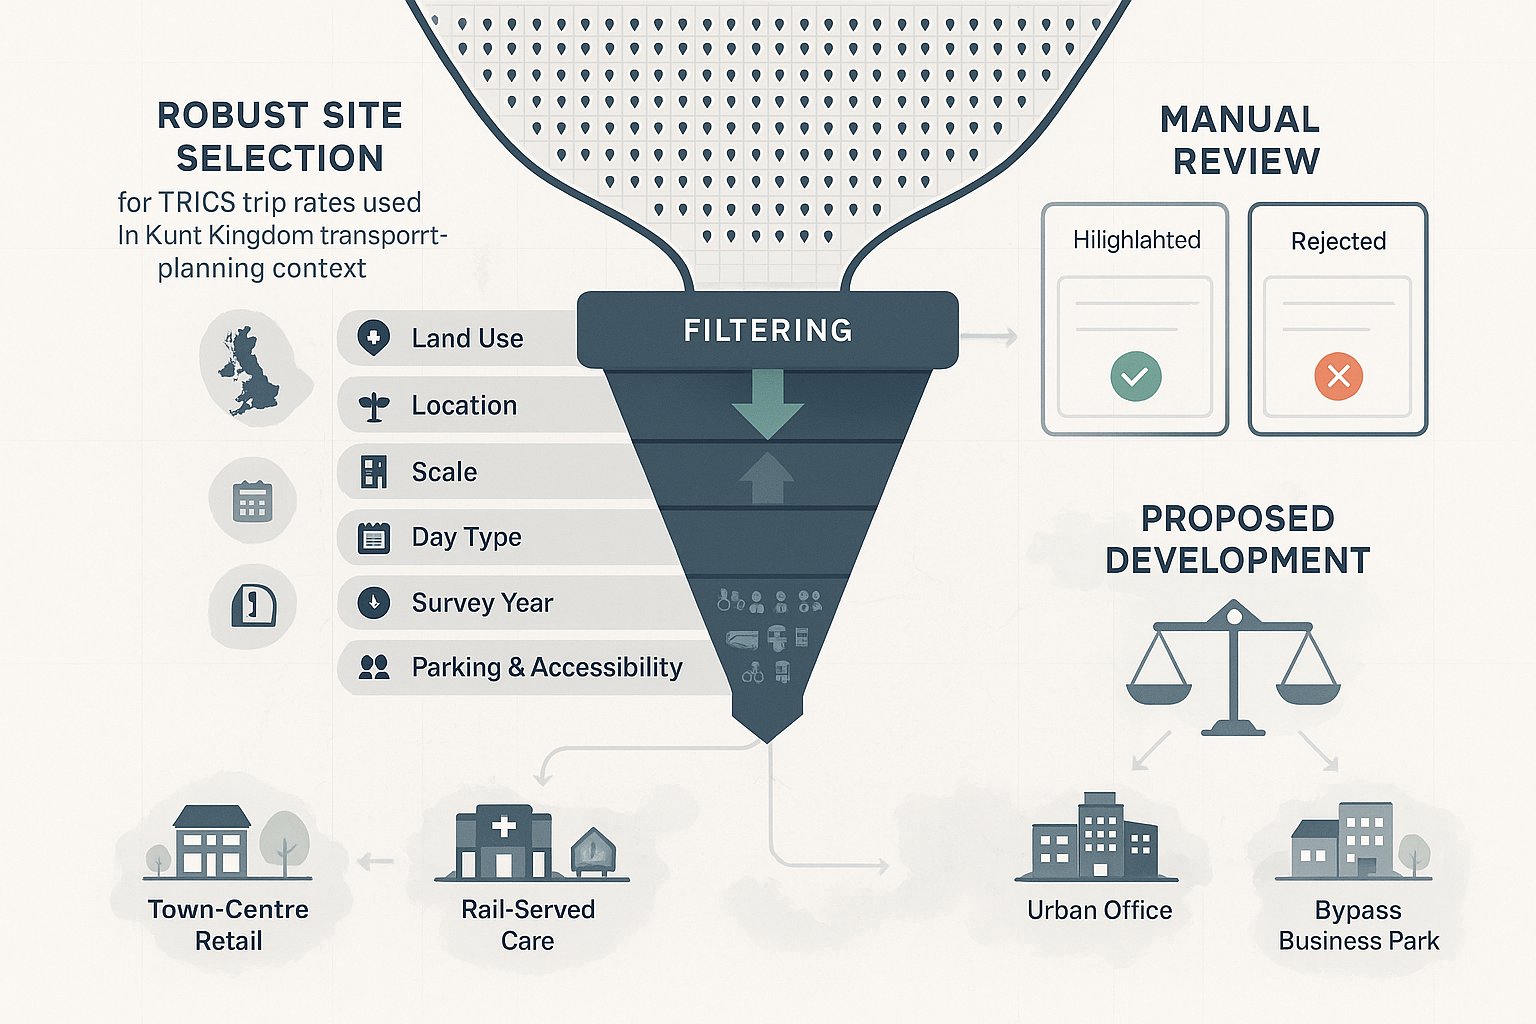
Selecting TRICS sites is where professional judgement really shows. The database contains thousands of surveys across many land uses and regions, collected using a standard methodology and updated regularly. That breadth is useful, but it also means we have to filter carefully. If we choose comparison sites lazily, the output may look precise while being fundamentally unconvincing.
A robust site selection process starts with the proposed land use and asks a simple question: what surveyed sites are genuinely comparable in operation, context and scale? Not vaguely similar. Comparable. A suburban foodstore with generous parking and weak bus access is not the same as a town-centre store with constrained parking and strong footfall. An edge-of-settlement care home does not behave like one next to a rail station. These differences matter.
TRICS lets us filter by factors such as region, day type, survey date, location category, size and accessibility. But filtering is only half the job. We still need to review individual sites manually. Sometimes a site technically meets the parameters but is clearly an odd fit. Sometimes a site sits just outside the range yet is obviously useful. Defensible analysis usually involves both structured filtering and informed inclusion or exclusion with reasons recorded.
Key Variables That Affect Trip Rate Selection
The obvious variable is land use. We need the closest available land use and sub-land use match, and where an exact match doesn’t exist, we need to explain why the selected category is the best proxy.
Then comes scale. TRICS trip rates are generally expressed per development unit, but behaviour is not always perfectly linear. A very small local convenience shop may not function like a superstore scaled down. A 20-home scheme may not behave exactly like a 300-home suburban estate. That’s why sensible parameter ranges matter.
Day type matters too. Weekday commuter patterns differ from Saturday retail patterns. So does survey year: while older surveys aren’t automatically unusable, more recent evidence is often easier to defend.
And then there’s location context: urban, suburban, edge-of-town, rural, town centre, residential area. This can materially affect mode split and car reliance, sometimes more than the land use itself.
Land Use, Location, Size, Parking, And Accessibility Considerations
In practice, we normally assess five things together: land use, location, size, parking and accessibility.
Land use should reflect how the site actually operates, not just what it is called in the planning description. Location affects trip patterns hugely: a city-centre office near rail and bus hubs will rarely mirror a business park office off a bypass.
Size needs care because very broad ranges can produce diluted, less meaningful averages. We usually prefer a bracket that reasonably surrounds the proposal without becoming so narrow that the sample is too weak.
Parking provision is another major driver. Sites with abundant free parking typically generate more car trips than constrained, managed or permit-controlled sites. That shouldn’t surprise anyone, but it’s often underplayed.
Finally, accessibility can shift mode choice significantly. Good walking links, cycle infrastructure, frequent public transport and local services nearby tend to reduce car dependency. In some cases, the trip rate selection should also reflect whether a site has travel planning measures in place. The point is not to force a low-car narrative. It’s to match real-world conditions as honestly as possible.
How To Calculate TRICS Trip Rates For A Proposed Development
The calculation process is simple on paper and nuanced in practice.
First, we select the most appropriate land use and sub-land use within TRICS. Then we choose the trip rate parameter that reflects the proposal, dwellings, GFA, bedrooms, staff, pupil numbers or another relevant metric. After that, we set a sensible parameter range around the proposed size so the sample isn’t distorted by sites that are clearly too small or too large.
Next come the primary filters. These may include region, survey day, location type, survey method and date range. Depending on the scheme, we may also use secondary filters such as local population catchment, car ownership characteristics, public transport accessibility or the presence of a Travel Plan.
Then comes the part that shouldn’t be skipped: manual review. We look through the selected surveys one by one and sense-check them. Are they genuinely comparable? Do any stand out as outliers because of unusual parking restraint, tourist function, mixed-use overlap or awkward site layout? If we exclude sites, we record why.
TRICS then derives mean trip rates from the chosen sample and reports arrivals, departures and total movements by time period. To calculate the proposal’s forecast trips, we multiply the selected trip rate by the development size. If we’re using multi-modal outputs, we do the same by mode.
A quick example makes it clearer. Suppose the selected AM peak vehicle departure rate for a residential scheme is 0.42 trips per dwelling, and the proposal is 80 dwellings. The forecast AM departures would be 33.6, usually rounded appropriately for reporting or modelling. The same process applies to arrivals, totals and other time periods.
Where uncertainty exists, we normally run sensitivity tests. That might mean comparing mean and percentile outcomes, reviewing alternative site sets, or testing a more locally comparable subset. The point isn’t to manipulate the result. It’s to demonstrate that the forecast is robust enough to stand up in planning.
Arrivals, Departures, Pass-By, Linked Trips, And Total Traffic Generation
One area that often causes confusion is the distinction between gross movements and net new traffic on the network.
TRICS typically gives us arrivals, departures and total trips for selected time periods based on observed survey data at comparable sites. Those are gross site movements. They are essential, because access design, internal circulation and parking demand often depend on gross activity at the site itself.
But planning and highway impact work sometimes needs more than that. We may need to consider whether some of those trips are already on the network and would simply divert into the site. That’s where pass-by and linked trips come in.
Pass-by trips are trips already travelling on the adjacent road network that make an intermediate stop at the development. This is common in roadside retail, drive-through and some convenience uses. Linked trips are journeys where the new development is one stop in a wider multi-purpose chain, such as town-centre shopping combined with another errand.
TRICS itself does not automatically solve those adjustments for us. It provides observed trip generation: reductions for pass-by or linked trips are usually handled outside the raw TRICS output and should be justified by local evidence, published guidance or site-specific characteristics. That’s where caution is essential. Over-claiming reductions is one of the fastest ways to lose credibility with a planning officer or highway authority.
We also need to distinguish total traffic generation from the development’s effect at a given junction or route. The former is a site-level output. The latter depends on assignment, distribution, committed development, background growth and, sometimes, mode shift assumptions. In other words: trip generation is the beginning of the transport story, not the end of it.
Common Mistakes In TRICS Trip Rate Analysis And How To Avoid Them
The most common mistake is choosing a land use that is technically available in TRICS but not operationally comparable to the proposal. It’s easy to do, especially with mixed-use, specialist or evolving development formats. But if the comparison is weak, everything downstream becomes shaky.
Another frequent problem is over-broad filtering. A huge sample can look statistically comforting while hiding obvious inconsistencies in location, size, parking and accessibility. Bigger is not always better. We’d rather defend a smaller, well-matched sample than a sprawling one that says very little.
There’s also the opposite issue: filtering so tightly that only a handful of sites remain, making the result fragile. Good judgement sits somewhere between those extremes.
A third mistake is failing to document why sites were included or excluded. If the assessment can’t show its workings, it’s much harder for an authority to trust the outcome. Transparency matters almost as much as the result itself.
We also see assessments that focus only on vehicle trips and ignore person trips or multi-modal outputs where they are plainly relevant. That feels dated now. In many authorities, sustainable travel evidence is no longer optional background colour: it is central to policy compliance.
Then there’s the issue of scaling. Applying a rate mechanically to a very small or very large proposal without checking whether the relationship is truly linear can produce distorted forecasts. Sensitivity testing helps here.
Finally, some reports still fail to follow recognised TRICS Good Practice Guidance. That tends to show up in vague filtering logic, weak justification and unsupported adjustments. The fix is rarely complicated: choose carefully, explain clearly, and test assumptions before someone else does it for you.
What Local Planning Authorities Expect From A Defensible Trip Rate Assessment
Most local planning authorities are not looking for perfection. They are looking for a clear, evidence-based and transparent assessment they can follow and, if appropriate, rely upon.
That usually means a few things. First, they expect the methodology to align with TRICS Good Practice Guidance and accepted transport planning practice. Second, they expect the chosen sites to be demonstrably comparable in land use and context. Third, they expect the numbers to be presented clearly enough that another professional can trace the logic from database selection to final forecast.
A defensible trip rate assessment should normally set out:
- the proposed development parameters:
- the TRICS land use and scale parameter used:
- the filters applied:
- the selected survey sites:
- reasons for exclusions or manual amendments:
- the resulting trip rates by time period:
- arrivals, departures and totals:
- and any mode split, pass-by or linked-trip adjustments with evidence.
Authorities also tend to expect the analysis to reflect the real planning context. If a site is close to a railway station, on a strong bus corridor, within walking distance of shops and subject to parking restraint, the assessment should engage with that. If it is rural and car dependent, it should say so plainly.
From our experience at ML Traffic, the reports that move through planning more smoothly are usually the ones that are concise, locally tuned and upfront about assumptions. Not flashy. Just solid. Highway officers can usually spot when a trip rate exercise has been assembled to defend a number rather than understand a development.
When TRICS Alone Is Not Enough And Additional Evidence Is Needed
TRICS is powerful, but it is not magic. Some proposals simply fall outside the range where a database comparison on its own is enough.
That often happens with very large mixed-use schemes, unusual attractions, logistics uses with atypical operating patterns, or developments in locations with policy-led travel behaviour that historic survey sites do not properly represent. If the sample is sparse or the comparisons are weak, pretending otherwise doesn’t help.
In those cases, we may need local traffic surveys, bespoke count data, operator information, census journey-to-work evidence, public transport boarding data, mobile data, or strategic transport model outputs. For junction impact work, we may also need assignment and distribution evidence that TRICS alone cannot provide.
There’s a second category where extra evidence is especially important: schemes expected to deliver a materially different mode split from historic norms. Think highly accessible urban sites, car-free or low-car developments, student accommodation near campuses, or regeneration sites tied to significant walking, cycling and public transport investment. Historic TRICS vehicle rates may overstate car use unless they are interpreted carefully and supplemented with local evidence.
That does not mean abandoning TRICS. Usually it still provides a baseline or benchmark. But we should be honest about its limits. A robust planning case often combines TRICS with local context, observed surveys and policy-aware judgement.
In short, if the proposal is unusual, the stakes are high, or the transport impacts are sensitive, additional evidence is not a luxury. It’s often what turns a technically adequate assessment into a credible one.
Conclusion
TRICS trip rates remain one of the core tools in UK development planning because they provide a recognised, evidence-based starting point for forecasting trip generation. But the keyword there is starting point. The quality of the outcome depends on how carefully we match land use, scale, location, parking and accessibility, and how transparently we explain the choices made.
Used well, TRICS supports better Transport Assessments, clearer Travel Plans and more defensible planning decisions. Used badly, it creates arguments, not answers.
For architects, planners, developers, lawyers and local authorities, the practical takeaway is simple: don’t treat trip rates as a box-ticking exercise. Treat them as professional evidence that needs judgement, context and, where necessary, support from local data. That’s how we get from a database output to an assessment that can actually stand up to scrutiny in 2026.
Frequently Asked Questions about TRICS Trip Rates
What are TRICS trip rates and why are they important in UK development planning?
TRICS trip rates are empirically derived estimates of trips generated by specific land uses, used across the UK to forecast transport impacts from new developments. They provide an evidence-based foundation for planning decisions and help assess traffic, pedestrian, cycling, and public transport demand.
How do TRICS trip rates support Transport Assessments and Travel Plans?
TRICS data underpins Transport Assessments and Statements by forecasting likely trip generation, which informs access design, junction capacity, parking strategy, and sustainable travel measures. They also provide multi-modal trip forecasts essential for developing effective Travel Plans.
What factors must be considered when selecting TRICS sites for trip rate calculations?
Site selection involves matching land use and sub-land use, location type (urban, suburban, rural), scale of development, parking provision, day type, and accessibility. Manual review and justification of included and excluded sites ensure comparability and robustness of the trip rates used.
How are TRICS trip rates calculated for a proposed development?
Calculation involves selecting the comparable land use and trip rate parameter (e.g., per dwelling or per 100 m²), filtering sites by region, day, year, and location type, reviewing surveys manually, deriving mean trip rates, then multiplying by the proposed development size to estimate total trip generation.
Why is it important to consider multi-modal trip rates instead of just vehicle trip rates?
Multi-modal trip rates capture trips by walking, cycling, public transport, car drivers, and passengers, providing a fuller picture of travel behaviour. This supports compliance with sustainable travel policies, improves accessibility assessments, and enhances the credibility of Travel Plans.
When might TRICS trip rates alone be insufficient, and what additional evidence is needed?
TRICS may be inadequate for very large mixed-use developments, unique land uses, or areas with policy-driven mode shifts (e.g., car-free urban sites). Additional evidence like local traffic surveys, census data, operator info, or strategic transport modelling is needed to produce robust and credible forecasts.