Category: High Frequency Posts

  • Large Mixed-Use Urban Regeneration Schemes Transport Assessment: What Planning Teams Need To Get Right In 2026

    Large Mixed-Use Urban Regeneration Schemes Transport Assessment: What Planning Teams Need To Get Right In 2026

    Urban regeneration projects rarely fail because of a single junction model or one awkward access point. More often, they stall because the transport story is incomplete. A large mixed-use regeneration scheme has to work as a place before it can work as a planning application: people need to arrive, move through it, service it, park within it, and live with it during construction and phasing.

    That is why a Large Mixed-Use Urban Regeneration Schemes Transport Assessment needs a different level of care from a standard single-use development appraisal. Residential, office, retail, leisure and community uses do not behave in neat silos. Their trip patterns overlap, offset and shift across the day. Internal trips can reduce external demand. Good public transport and walkable street networks can materially change mode share. And temporary phases can create impacts that matter just as much as the completed scheme.

    For architects, planners, lawyers, surveyors, developers, builders and local authorities, the practical challenge in 2026 is clear: present a transport assessment that reflects how the scheme will actually function, not just how a spreadsheet says it might. In this text, we set out what planning teams need to define early, test properly and resolve before determination, so that transport becomes a planning enabler rather than the reason a major regeneration proposal drifts into delay.

    Key Takeaways

    • A Large Mixed-Use Urban Regeneration Schemes Transport Assessment requires bespoke methodologies that reflect complex, overlapping trip patterns and phased site evolution.
    • Accurate baseline transport conditions, including traffic, accessibility, and kerbside activity, are essential to build a credible assessment and avoid later challenges.
    • The transport assessment must integrate walking, cycling, and public transport accessibility evidence to support mode shift and sustainable urban mobility.
    • Servicing, deliveries, parking strategy, and kerbside management should be explicitly detailed and operationally feasible to prevent objections and operational conflicts.
    • Construction and phased occupation impacts need thorough assessment and mitigation strategies to ensure smooth interim site functioning.
    • Early engagement with planning authorities, clear development definitions, and integrated mitigation tied to the wider place vision expedite planning decisions and reduce delays.

    What Makes Transport Assessment Different For Urban Regeneration Schemes
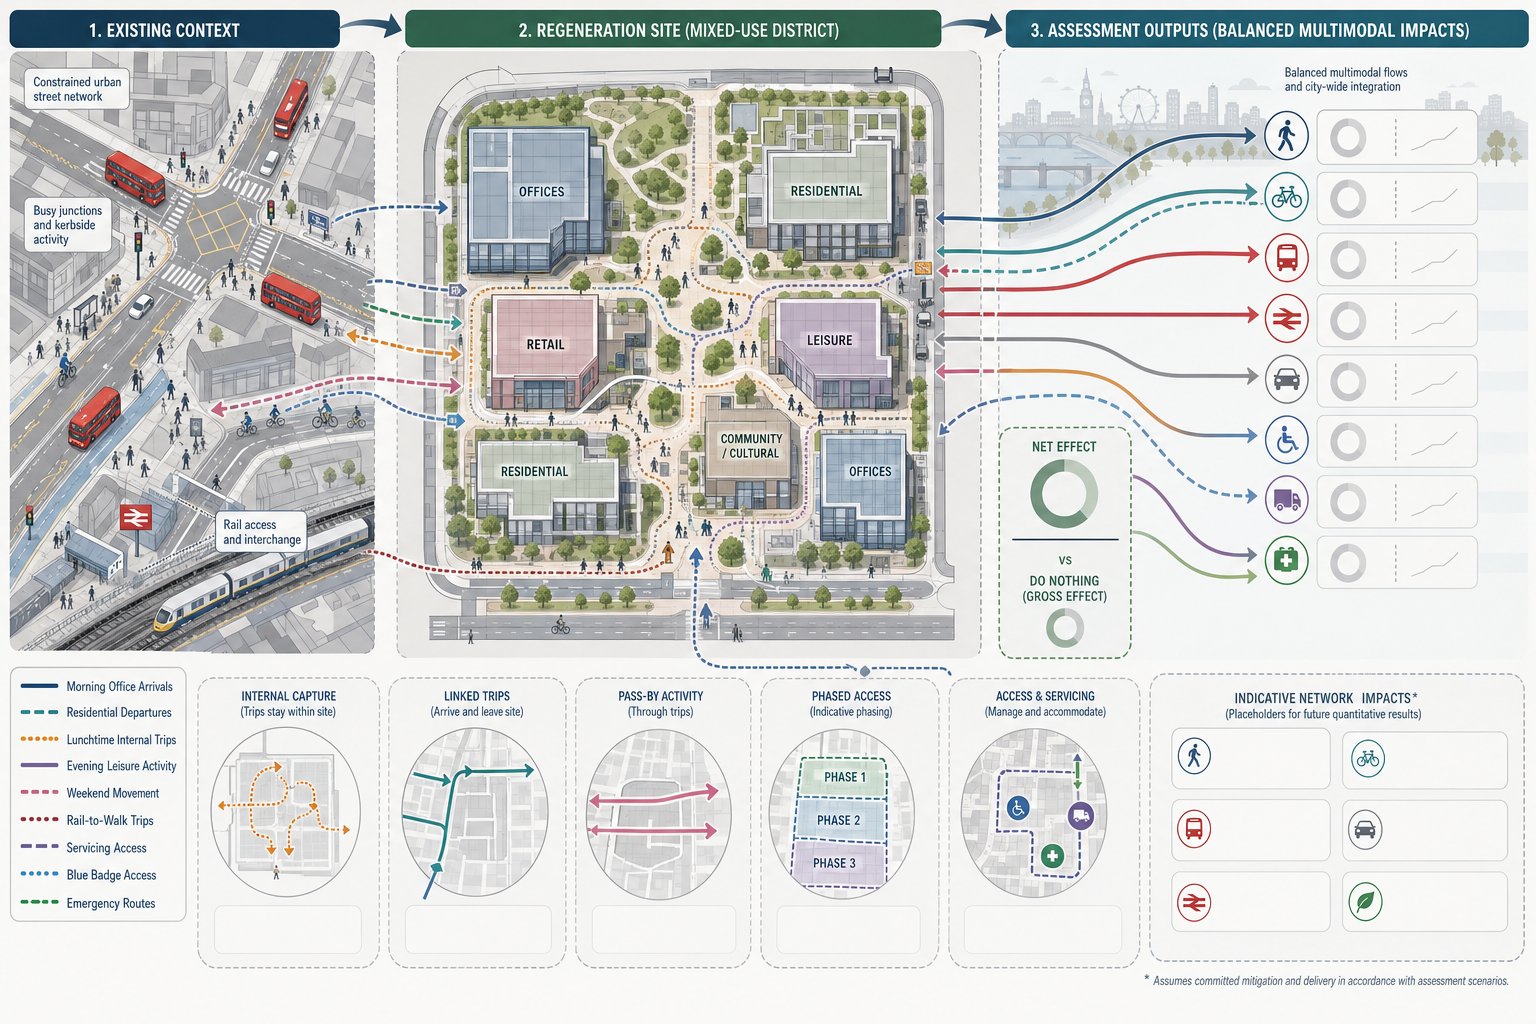
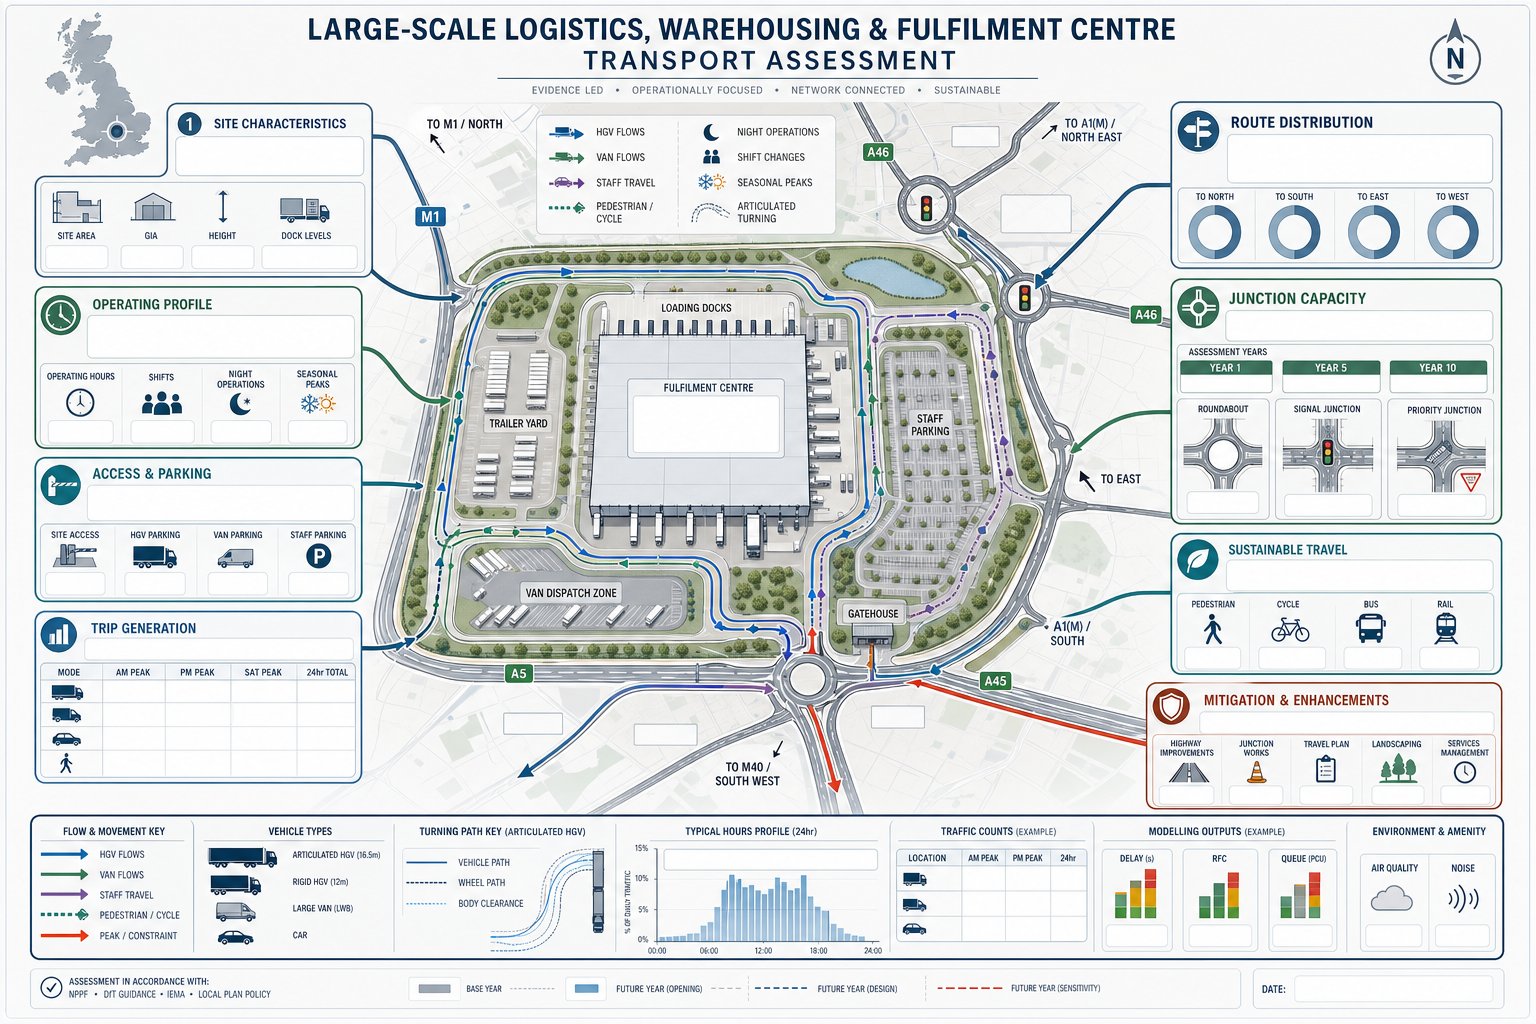
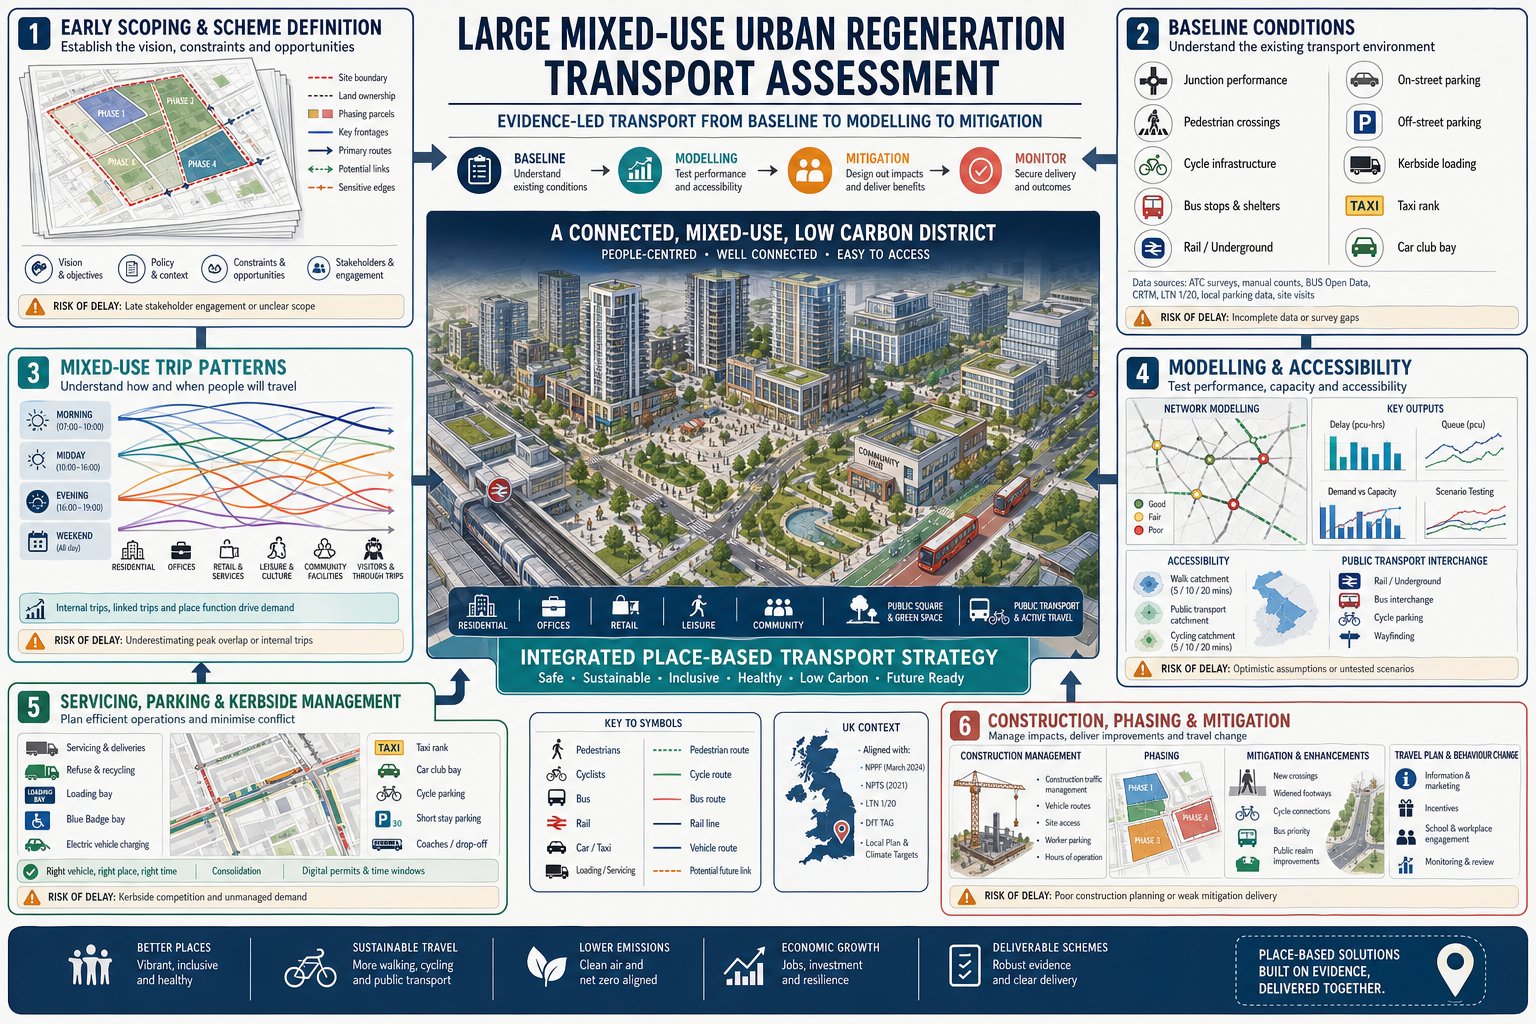
    Infographic of transport flows and assessment factors in a UK mixed-use regeneration site.

    A regeneration-led transport assessment is not simply a larger version of a suburban housing TA. The core difference is complexity of movement. Mixed-use urban sites usually sit in constrained networks, rely on several modes, and evolve in phases over years rather than months. Existing streets may already be busy, kerbside activity may be intense, and there may be political pressure to reduce car dependence while still protecting access for servicing, blue badge users and emergency vehicles.

    That means the assessment has to do more than count forecast trips. It has to explain how the site integrates with the surrounding town or city, how access will operate at different stages, and whether the transport strategy supports the planning vision. In practice, we often need a more bespoke methodology than a standard edge-of-town development would require. The principles behind a broader transport assessment for developments still apply, but regeneration schemes demand more detailed judgement around internalisation, accessibility and operational management.

    How Mixed-Use Trip Patterns Change Assessment Assumptions

    This is where many applications either become persuasive or start to wobble. Standard trip-rate databases are useful, but they can overstate impacts if applied crudely to a mixed-use scheme. Office arrivals may peak in the morning: residential departures may do the same: retail and leisure can strengthen lunchtime, evening and weekend activity. Some trips will stay on site. Others will transfer from existing nearby destinations.

    So we should test net effects by time period and by mode, not just present gross vehicular generation. A resident walking to an on-site gym or café is movement, but not highway impact. A worker arriving by rail and walking through the scheme still matters for public realm and crossing design. The right approach is to identify linked trips, internal capture, pass-by activity where relevant, and realistic mode split assumptions based on actual urban context. Done well, that produces a truer picture of impact and a stronger planning case.

    When A Full Transport Assessment Is Required
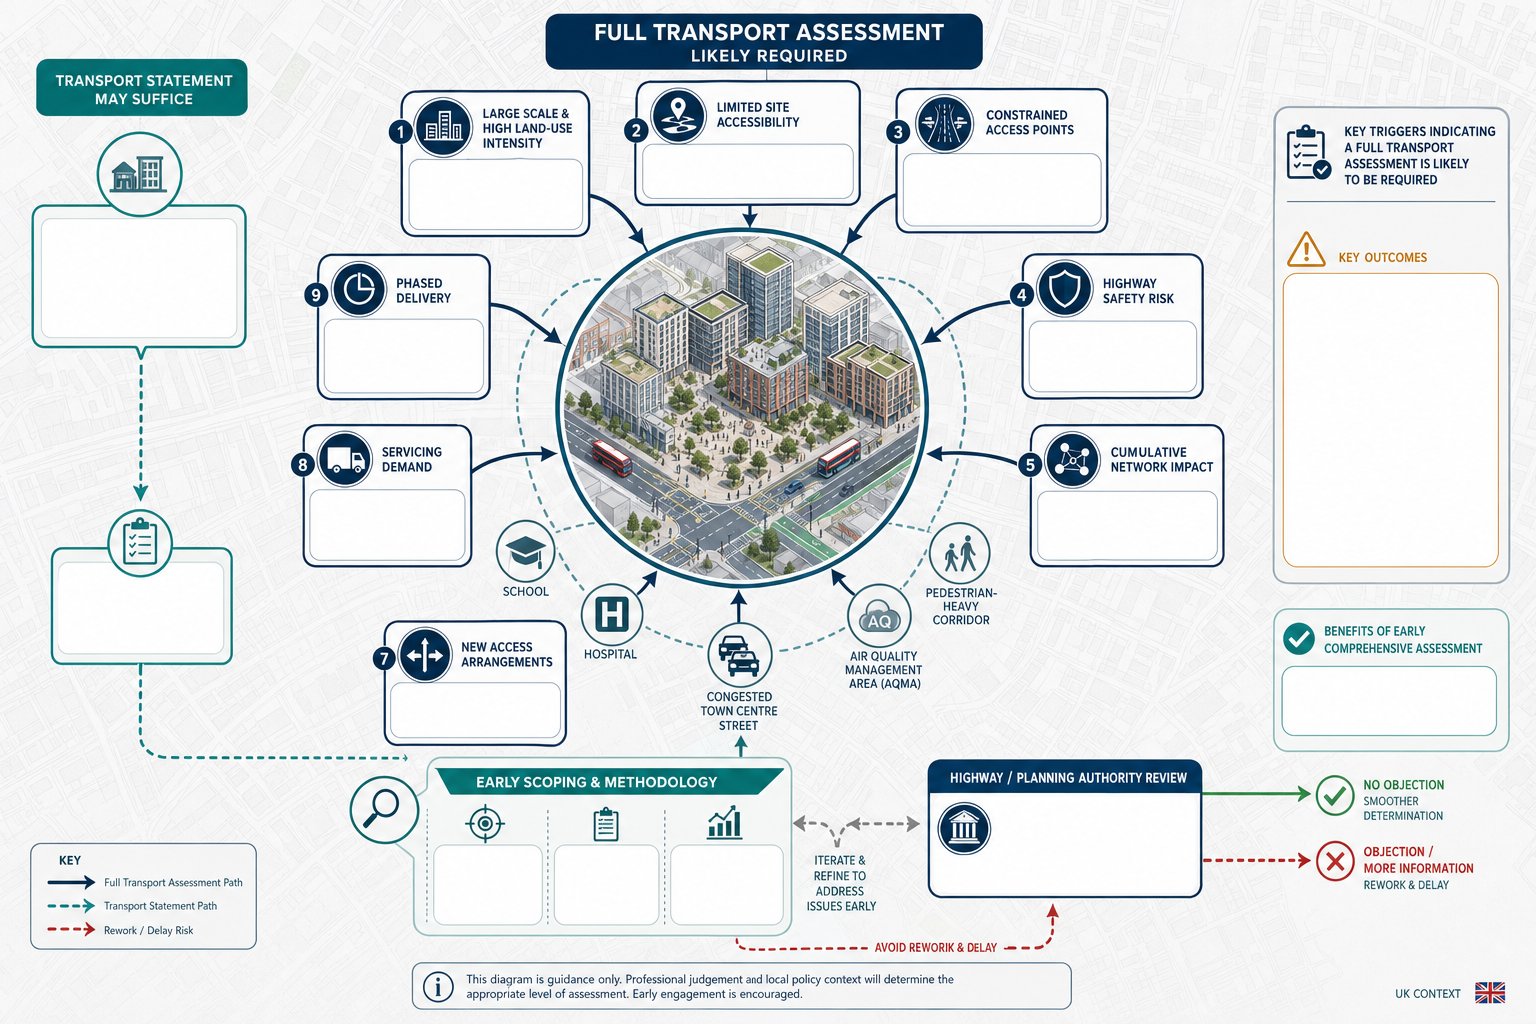
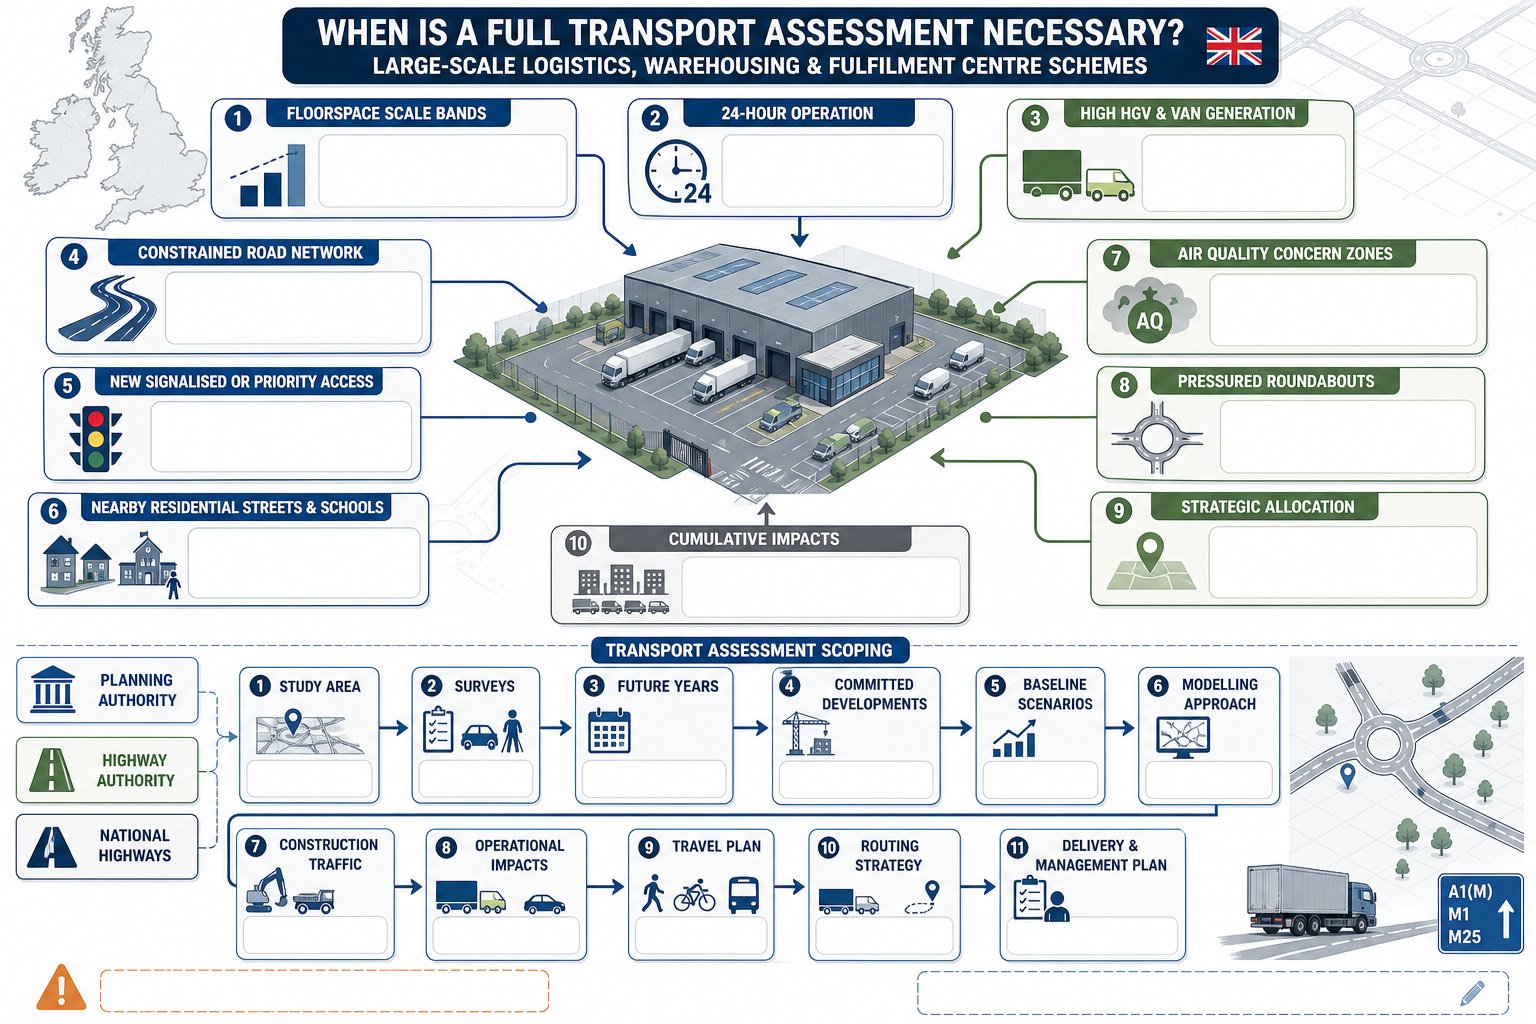
    Flowchart showing triggers for a full transport assessment on major UK regeneration schemes.

    Not every application needs a full transport assessment, but large urban regeneration schemes very often do. In 2026, local planning authorities and highway authorities still focus on the same practical triggers: scale, land-use intensity, site accessibility, access constraints, highway safety concerns, cumulative impact and whether transport effects could influence the planning decision.

    For major mixed-use proposals, a Transport Statement is rarely enough unless the development is modest in scale or reserved matters are tightly controlled by an already-tested outline consent. If the scheme introduces substantial floorspace, new access arrangements, network changes, significant servicing demand or multi-phase delivery, a full TA is typically the safer and more credible route. That is especially true where there are sensitive receptors nearby: schools, hospitals, congested town centre corridors, air quality management areas or heavily used pedestrian streets.

    We also need to think beyond formal thresholds. Sometimes the site is technically accessible, but politically sensitive. Sometimes a local authority is pursuing modal shift targets, bus priority or town centre public realm changes, and the transport evidence has to demonstrate alignment. In those cases, robust scoping matters early. A clear methodology, agreed with officers where possible, can avoid the familiar cycle of under-submission, consultation objection and expensive rework.

    Defining The Development, Site Context, And Planning Scope
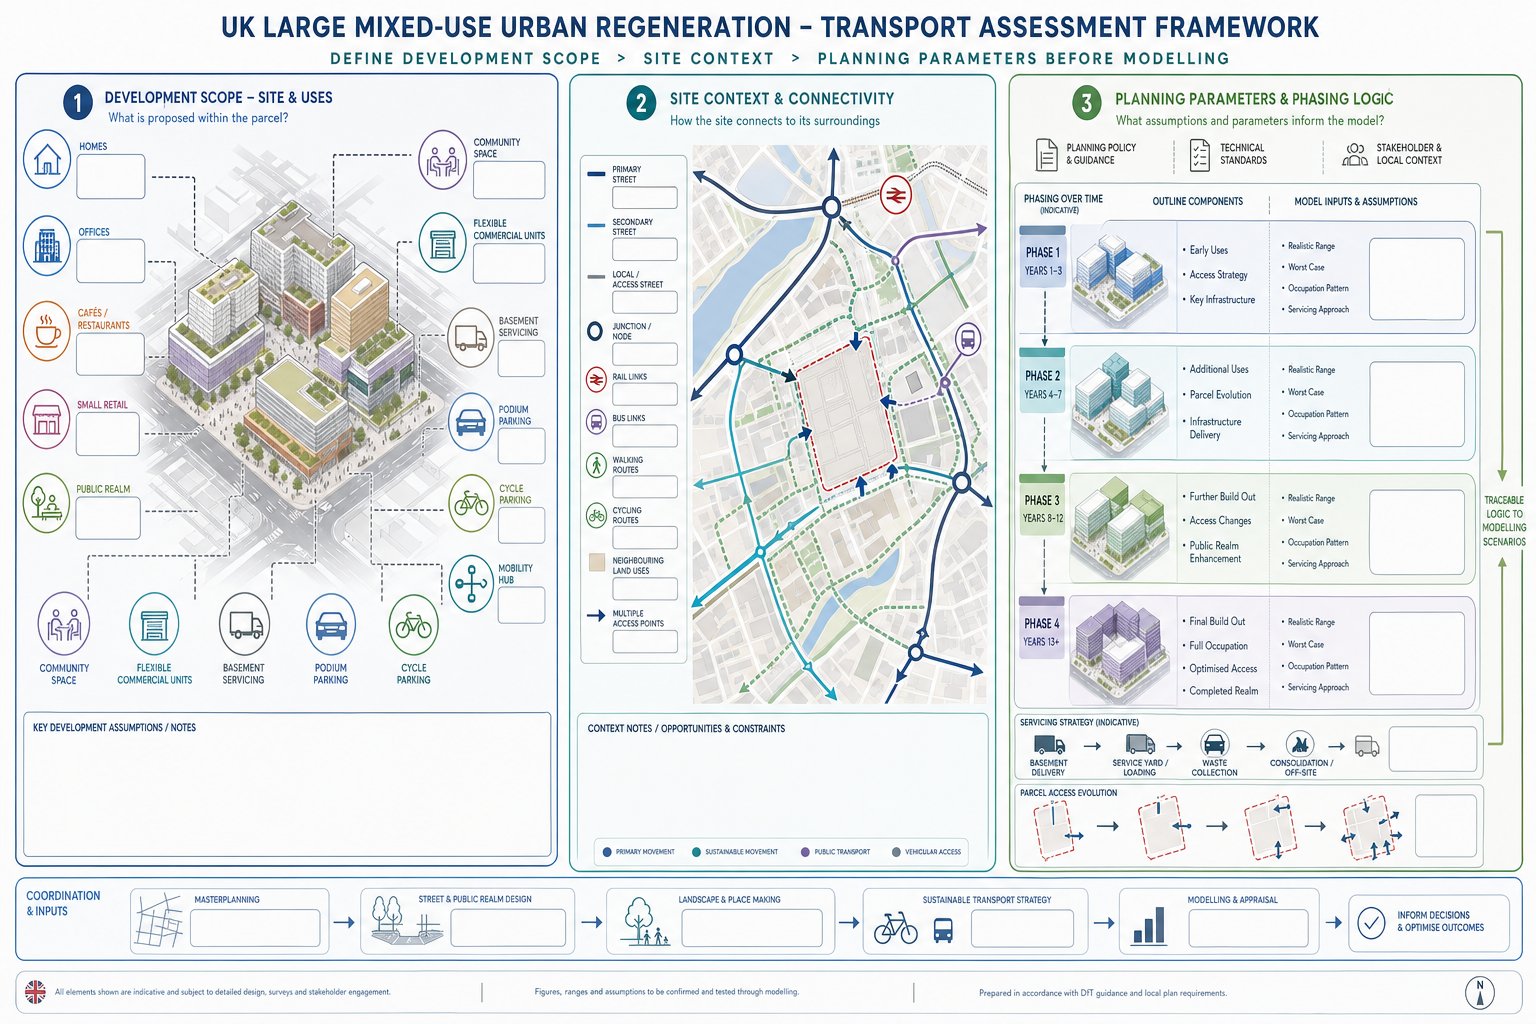
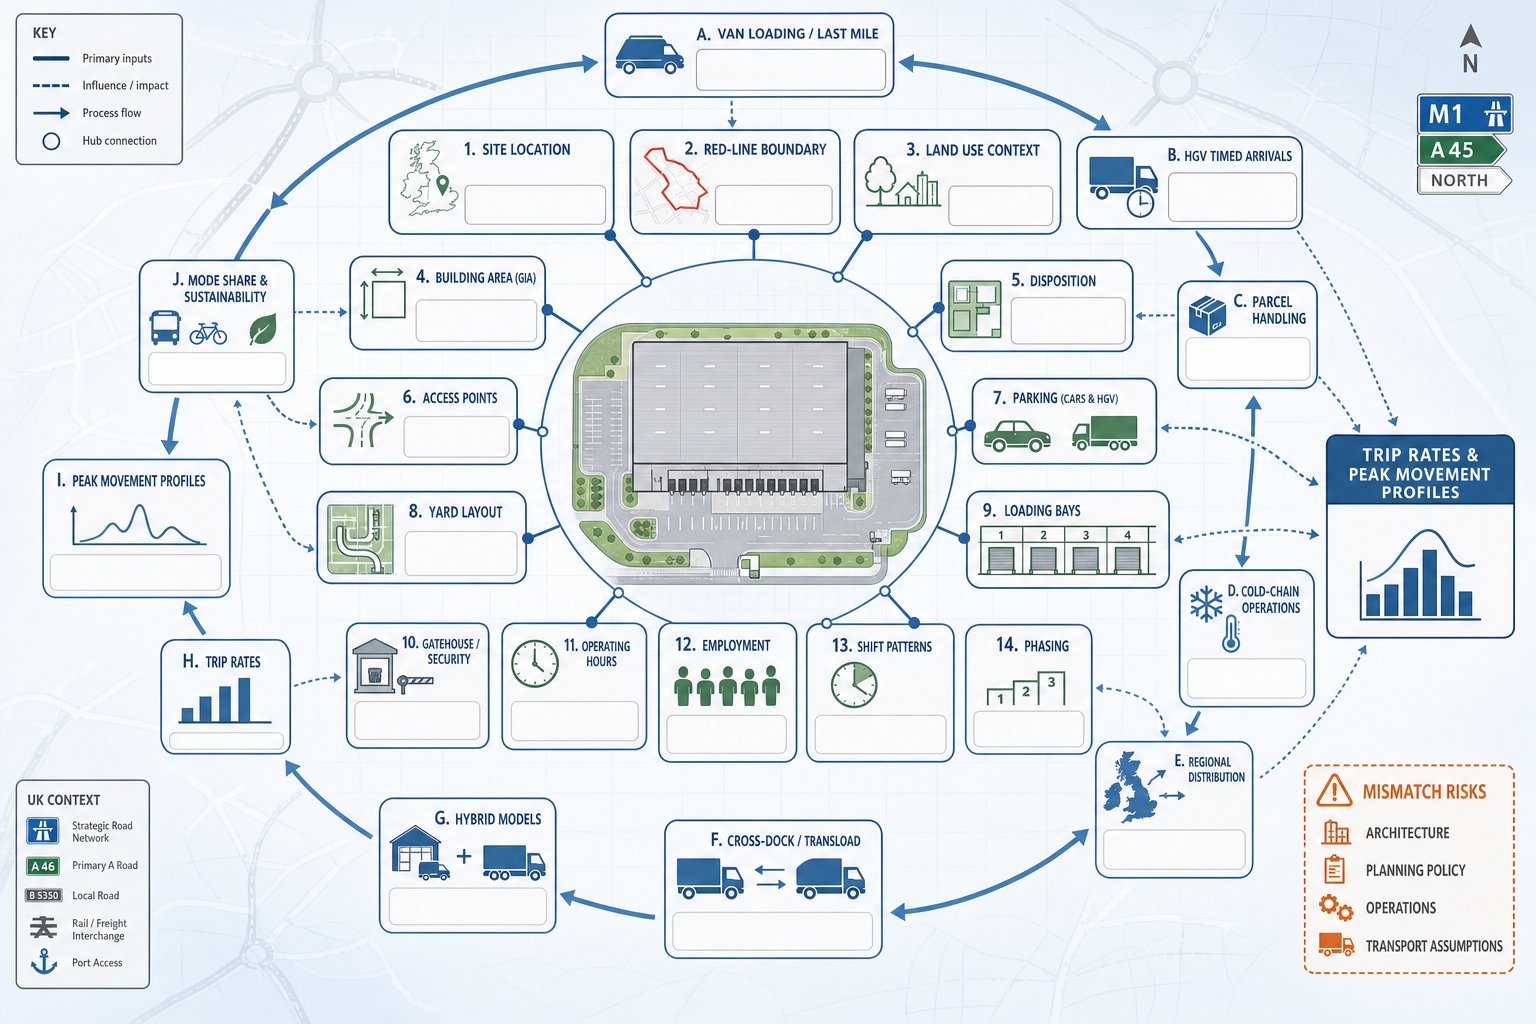
    Infographic of mixed-use regeneration site scope, context, access, and phasing.

    Before we model anything, we need to define what is actually being assessed. That sounds obvious, yet it is a common weak point in regeneration applications. A mixed-use scheme may include homes, workspace, food and drink, small-format retail, public realm, flexible commercial units, community uses, basement servicing, podium parking, mobility hubs and temporary phases. If those elements are vague, the transport assessment will be vague too.

    The scheme description should set out land uses, quantum, dwelling mix where relevant, access points, servicing strategy, parking provision, cycle parking, anticipated occupation patterns and the phasing logic. For outline schemes, the assessment must still establish realistic parameter ranges and sensible worst cases. For hybrid applications, we need to separate detailed and outline components carefully so that modelling assumptions are traceable.

    Urban regeneration also requires us to explain the planning context around the site: neighbouring uses, existing street hierarchy, public transport connections, proposed area changes and local policy ambitions. This is where early coordination with masterplanning teams pays off. A transport strategy is stronger when tied directly to street design, active frontages and public realm intent, rather than bolted on later. In that sense, the thinking behind Masterplan Transport Inputs: A practical planning process is particularly relevant to regeneration sites with multiple development parcels and evolving access arrangements.

    Establishing The Baseline Transport Conditions
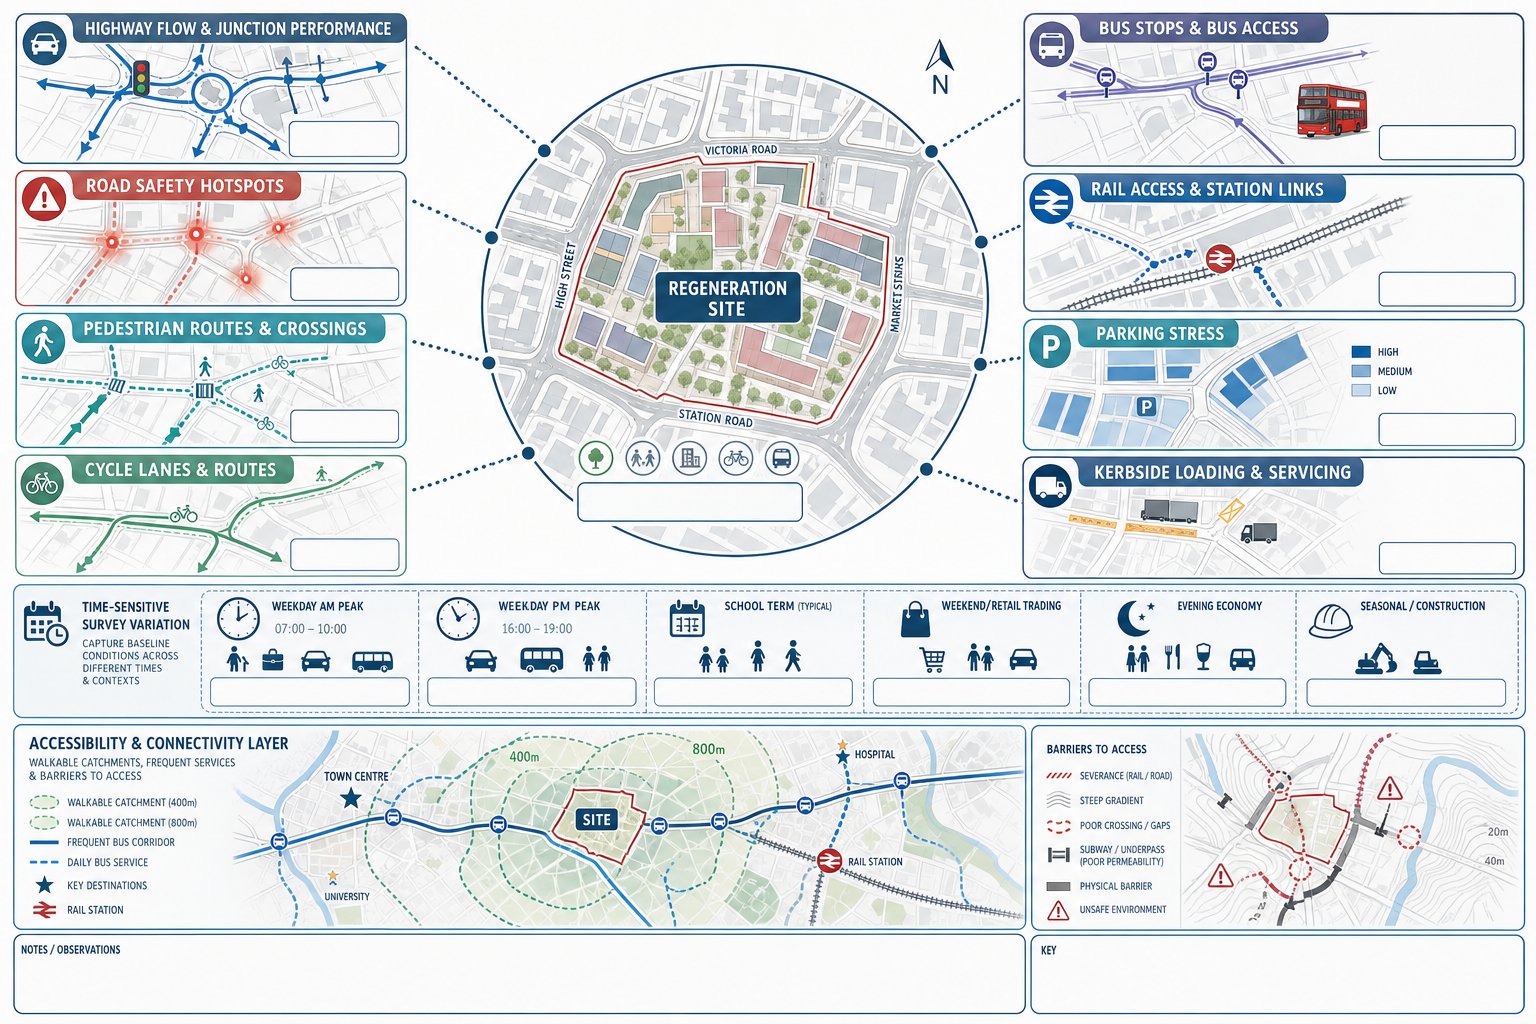
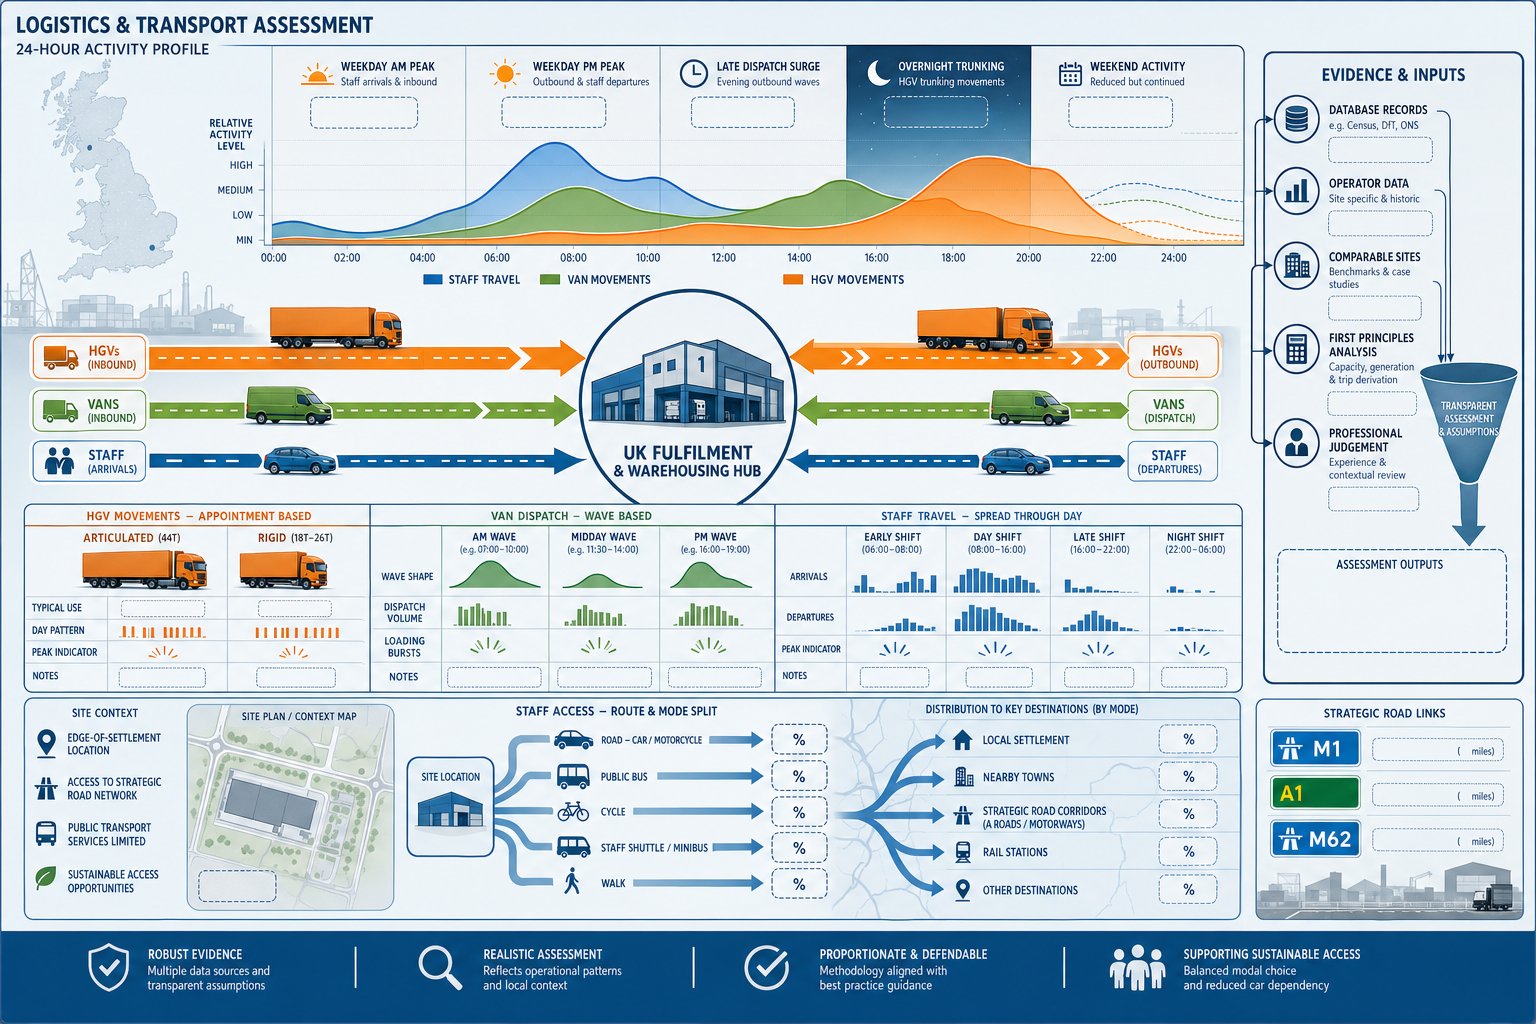
    Urban transport baseline infographic with site access, surveys, timing, and constraints.

    A credible baseline is the foundation of the entire assessment. If existing conditions are weakly described or based on stale surveys, every later conclusion becomes easier to challenge. For regeneration schemes, baseline work should cover highway operation, junction performance, road safety, pedestrian routes, cycle infrastructure, public transport services, parking stress, kerbside activity and accessibility to key destinations.

    We should also be careful about timing. Urban sites can vary sharply by weekday peak, school term, weekend trading, evening economy activity and seasonal construction nearby. One set of counts may not tell the whole story. In some cases, supplementary surveys are worth the effort, especially where the authority is likely to scrutinise pedestrian crossings, bus stop capacity or kerbside loading pressure.

    Accessibility review matters just as much as traffic counts. If the site sits within walking distance of rail, high-frequency bus routes and everyday services, that should shape mode split assumptions and mitigation priorities. Equally, if severance, steep gradients or poor crossing conditions suppress active travel, the baseline needs to show that honestly. Good baseline analysis is not about painting the site in the best possible light. It is about showing the real starting point, including constraints the design and mitigation strategy must resolve.

    Highway Capacity, Junction Modelling, And Network Performance
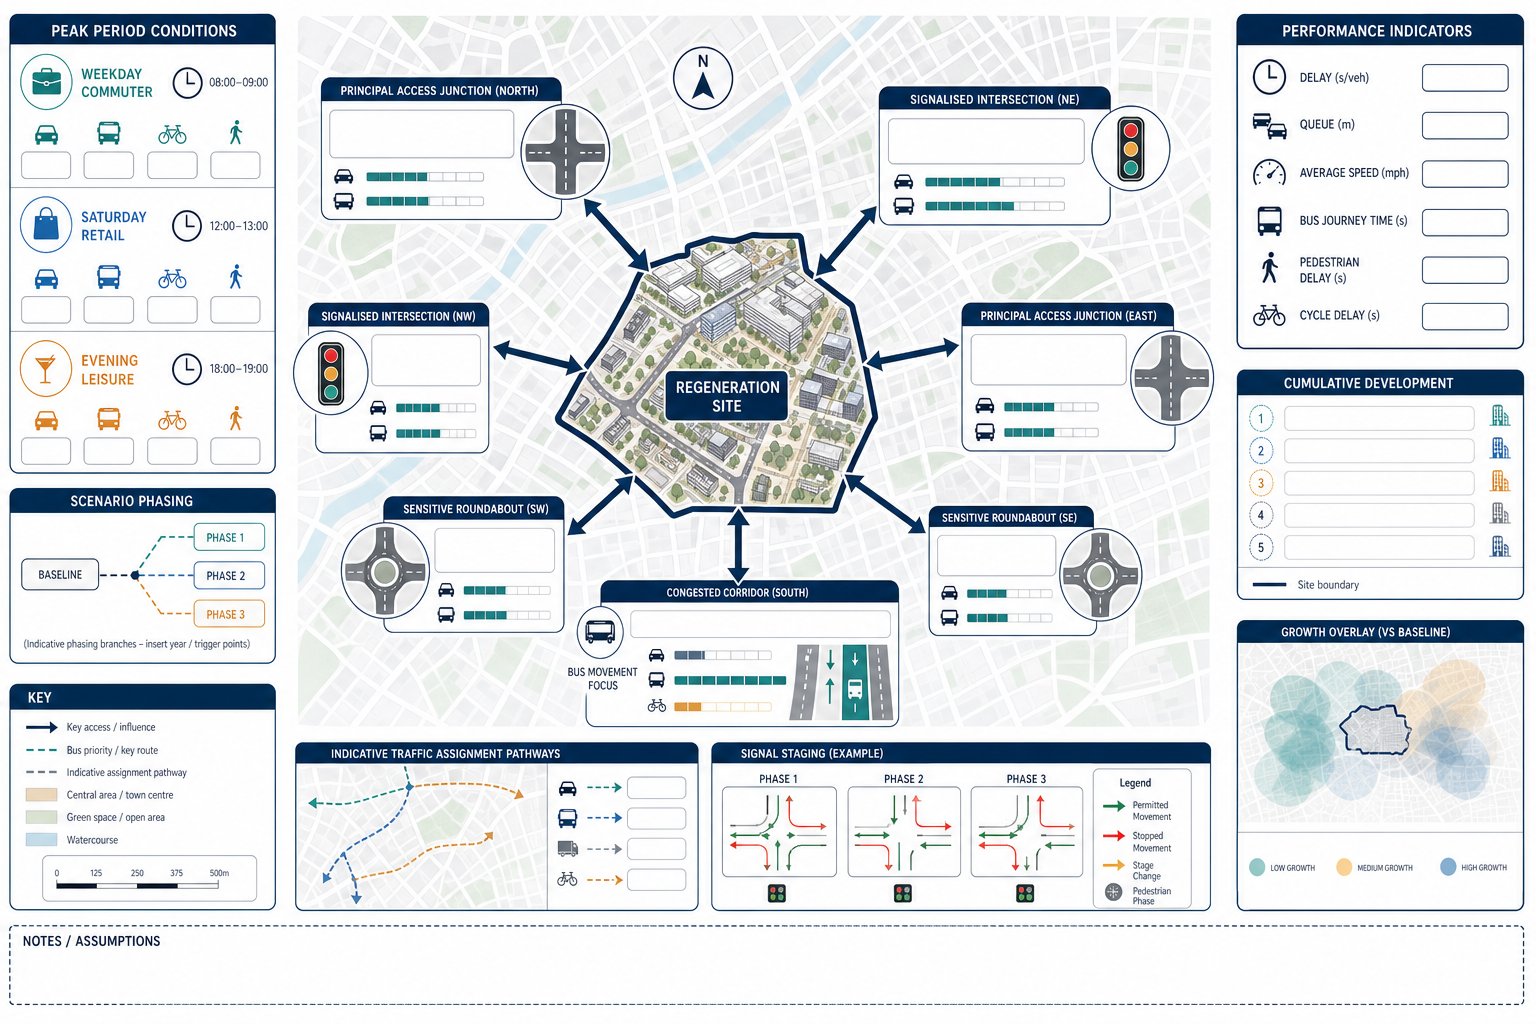
    urban transport assessment infographic with junctions, queues, and peak period comparisons

    Even on highly sustainable urban sites, highway modelling remains important. Decision-makers still need to know whether access junctions will operate safely, whether queues will create blocking back, and whether cumulative growth plus development traffic could materially worsen network performance.

    The key is proportionality and relevance. We do not need to model half a city because one regeneration block is proposed, but we do need to assess the junctions and corridors most likely to experience measurable impact. That usually includes principal access points, nearby signalised nodes, sensitive roundabouts and any corridor where bus reliability or queue interaction is already a concern. For larger schemes, it may also include phased testing and sensitivity scenarios.

    Software outputs are only as good as the assumptions behind them. We should be transparent on trip assignment, growth factors, committed development, signal staging and queue interpretation. And where microsimulation or detailed priority modelling is needed, it should answer a planning question, not just generate impressive appendices. Tools discussed in Junctions 11 Software In current practice are useful, but they need to sit within a clear narrative about how the street network functions.

    For mixed-use sites, net impact by period is especially important. A junction may perform acceptably in the traditional commuter peak yet face more pressure in a Saturday retail period or evening leisure window. Those patterns should be tested where relevant rather than assumed away.

    Walking, Cycling, Public Transport, And Accessibility Review

    This is the section too many transport assessments still underplay, even though it is often central to the planning case. A major urban regeneration scheme succeeds when it becomes easier to reach on foot, by cycle and by public transport than by private car for a meaningful share of trips. If that shift is only asserted and not evidenced, authorities will notice.

    The accessibility review should assess pedestrian permeability, footway quality, crossing opportunities, desire lines, cycle links, cycle parking, public transport frequency, interchange quality and step-free access where relevant. It should also consider how the development itself supports sustainable movement: active ground-floor frontages, direct walking routes, secure cycle storage, end-of-trip facilities, mobility hubs and wayfinding.

    For genuinely mixed-use places, this is more than a compliance exercise. The whole point is often to create a connected district where short internal trips replace some external car trips. That is why a mixed use masterplan transport strategy should be integrated with land-use distribution and public realm design from the outset. The strongest applications also reflect vision led transport principles, asking what kind of place the scheme is trying to become, then aligning movement accordingly.

    And yes, hard numbers still matter: PTAL-style analysis where relevant, walk catchments, cycle isochrones, bus capacity and mode split evidence. But those numbers need to support a coherent place-based argument.

    Servicing, Deliveries, Refuse, And Operational Vehicle Movements

    One of the quickest ways for a regeneration application to attract late-stage objections is to undercook servicing. Mixed-use schemes generate a wide range of operational movements: parcel deliveries, food and beverage servicing, office supplies, retail stock, building maintenance, refuse collection, recycling, clinical or specialist deliveries in some cases, and emergency access requirements. These patterns do not behave like customer traffic and should never be buried inside generic trip-rate totals.

    A robust transport assessment should identify vehicle types, likely frequency, routing, on-site manoeuvring, waiting space, refuse collection arrangements and conflict points with pedestrians, cyclists and general traffic. If servicing is time-restricted, that needs to be workable in practice, not just neat on a plan. If loading occurs from the kerb, the interaction with bus stops, cycle lanes and neighbouring frontage activity must be addressed.

    In dense urban locations, a Delivery and Servicing Plan is often as important as the TA itself. The assessment should make clear whether vehicles can enter and leave in forward gear, whether basement ramps work for the intended fleet, and whether occupier management arrangements are realistic over time. This is one area where operational detail often carries more planning weight than headline trip generation, because poor servicing can undermine an otherwise sustainable scheme very quickly.

    Parking Strategy, Drop-Off, And Kerbside Management

    Parking strategy in regeneration projects is no longer just a numbers exercise. The harder question is how parking, pick-up, blue badge spaces, taxis, car clubs, short-stay loading and micro-mobility all fit within limited kerbside and basement space without creating conflict or overspill.

    A sound assessment should explain total parking provision, allocation by use, disabled parking, electric vehicle charging, cycle parking, visitor arrangements, car club spaces and the demand management logic behind the strategy. But it should also go further and test overlap. Residential demand rises overnight: office parking peaks by day: leisure and food uses may peak in the evening. Drop-off demand can be short but intense, especially for hotels, student accommodation, healthcare or event-related uses.

    Where parking is restrained, the evidence for that restraint has to be strong. That means demonstrating accessibility, realistic mode split, local parking controls and the likely effect on surrounding streets. In some applications, a linked parking stress survey is essential. In others, kerbside management plans matter more than off-street provision.

    The strongest submissions treat kerbside as a scarce operational asset, not leftover space. Booking systems for servicing, managed drop-off windows, enforcement mechanisms and occupier rules can all help. If those controls are needed to make the strategy work, they should be stated clearly in the TA and, where necessary, secured through management plans or planning conditions.

    Construction, Phasing, And Interim Transport Impacts

    Construction and phased delivery are often where regeneration schemes become most vulnerable. A completed development may function well, but planning officers and local communities will still ask what happens in year one, year three and the awkward in-between period when roads are diverted, plots are partly occupied and public realm is unfinished.

    A proper assessment should identify construction access routes, vehicle numbers, hours, temporary traffic management, workforce travel arrangements, abnormal loads where relevant and interface with existing neighbours. For long programmes, phasing analysis should also test interim site accesses, temporary parking arrangements, partial occupation scenarios and whether junction or crossing improvements need to arrive before, not after, certain phases open.

    This is especially important where regeneration proposals sit beside active town centre streets or live residential areas. A weak Construction Management Plan can generate more objection than the permanent transport effects. If the wider planning package includes environmental statements, transport effects during construction may also need to align with broader environmental impact assessment work, particularly around traffic, noise and air quality.

    Phasing should be presented as a transport question, not merely a programme note. If the site depends on later bridge links, bus re-routing, highway adoption or parcel-by-parcel access changes, that sequencing needs to be visible and tested.

    Mitigation, Travel Planning, And Section 106 Or Section 278 Measures

    Mitigation should not read like a shopping list attached at the end of the report. It should flow logically from the impacts identified and the place the scheme is trying to create. In regeneration projects, that often means combining physical works with operational controls and travel behaviour measures.

    Typical highway and access mitigation can include junction alterations, signal optimisation, new crossings, footway widening, cycle connections, bus stop improvements, servicing controls, parking restrictions and wayfinding. Some works may fall under Section 278. Others may be secured through Section 106 contributions, monitoring commitments or phased triggers linked to occupation levels.

    Travel planning also matters more than some teams assume. For a mixed-use scheme, there may be separate but coordinated travel plans for residents, employees, schools, leisure operators or managed workspace. Targets should be realistic, evidence-based and tied to measures people can actually use: cycle facilities, public transport incentives, car club membership, travel information, concierge-style mobility support or freight consolidation where suitable.

    A well-structured traffic impact assessment can help distinguish between impacts that require engineering mitigation and those better addressed through management and travel planning. The best outcomes usually come when we resolve that distinction early, before obligations become a negotiation fought under determination pressure.

    Common Risks That Delay Planning Decisions

    Most delays are predictable. We see them repeatedly across large regeneration schemes, and they are rarely caused by one dramatic flaw. Instead, they arise from several smaller weaknesses that erode confidence in the submission.

    The first is an unclear development description. If floorspace, access strategy, servicing or phasing are inconsistent across drawings, the TA becomes impossible to trust. The second is poor baseline evidence: out-of-date surveys, missing kerbside data, weak pedestrian analysis or no realistic account of nearby committed development. The third is unrealistic trip generation, especially where mixed-use internalisation is claimed but not evidenced, or where standard rates are applied without local adjustment.

    Another regular issue is under-modelled servicing and operational activity. Authorities may tolerate some flexibility on occupier mix, but they rarely like uncertainty on where delivery vehicles wait, turn or load. Parking overspill risk, blue badge provision and drop-off behaviour can also trigger prolonged queries. And then there is phasing: many schemes describe the end state well but leave interim access and temporary impacts dangerously thin.

    Finally, mitigation can hold up decisions when it is unresolved, unfunded or badly sequenced. A stronger Development Transport Assessment: approach usually comes from early scoping, honest baseline work, integrated design coordination and authority engagement before positions harden. In practice, speed often comes from clarity, not from submitting less.

    Conclusion

    For major regeneration proposals, transport assessment is no longer just about proving that extra vehicles can be squeezed through a nearby junction. The real test is whether the scheme functions as a connected urban place: one that supports walking, cycling and public transport, manages servicing properly, handles kerbside pressure, and remains workable through construction and phased occupation.

    That is why a Large Mixed-Use Urban Regeneration Schemes Transport Assessment has to be bespoke. The right question is not simply how many trips the development generates, but when those trips occur, which modes they use, how many are internal, and what changes as the site evolves over time.

    When planning teams define the scheme clearly, establish a robust baseline, test realistic mixed-use assumptions and tie mitigation to the broader place strategy, transport becomes much easier to defend. And in 2026, that can make the difference between a scheme that moves efficiently through planning and one that spends months stuck in avoidable transport queries.

    Frequently Asked Questions about Large Mixed-Use Urban Regeneration Schemes Transport Assessment

    What makes transport assessment for large mixed-use urban regeneration schemes different from standard developments?

    Transport assessments for large mixed-use urban regeneration schemes are more complex due to overlapping trip patterns, phased delivery, multiple access modes, and internal trip capture, requiring bespoke methodology beyond standard single-use development appraisals.

    When is a full transport assessment typically required for mixed-use urban regeneration projects?

    A full transport assessment is generally needed for large-scale schemes involving substantial floorspace, new access arrangements, significant servicing demand, or potential impact on sensitive receptors like schools or busy corridors where transport effects influence planning.

    How should trip generation be approached for mixed-use urban regeneration schemes?

    Trip generation should account for internal trips, linked trips, mode shifts, and time of day variations, testing net impacts by period and mode rather than relying solely on gross vehicular trips or standard trip-rate databases.

    Why is assessing walking, cycling, and public transport important in urban regeneration transport assessments?

    Because mixed-use schemes can support reduced car dependence, assessing pedestrian permeability, cycle routes, public transport access, and facilities is central to demonstrating sustainable movement and aligning transport strategy with place-making goals.

    How do construction and phasing impact transport assessment for large regeneration schemes?

    Construction and phased delivery affect temporary traffic management, site access, and interim transport impacts, requiring careful assessment of construction vehicle movements and phased scenarios to avoid delays and community objections.

    What are common risks that cause delays in planning decisions related to transport assessments?

    Delays often result from unclear development descriptions, poor baseline evidence, unrealistic trip generation, under-modelled servicing operations, inadequate phasing plans, and unresolved mitigation or funding arrangements.
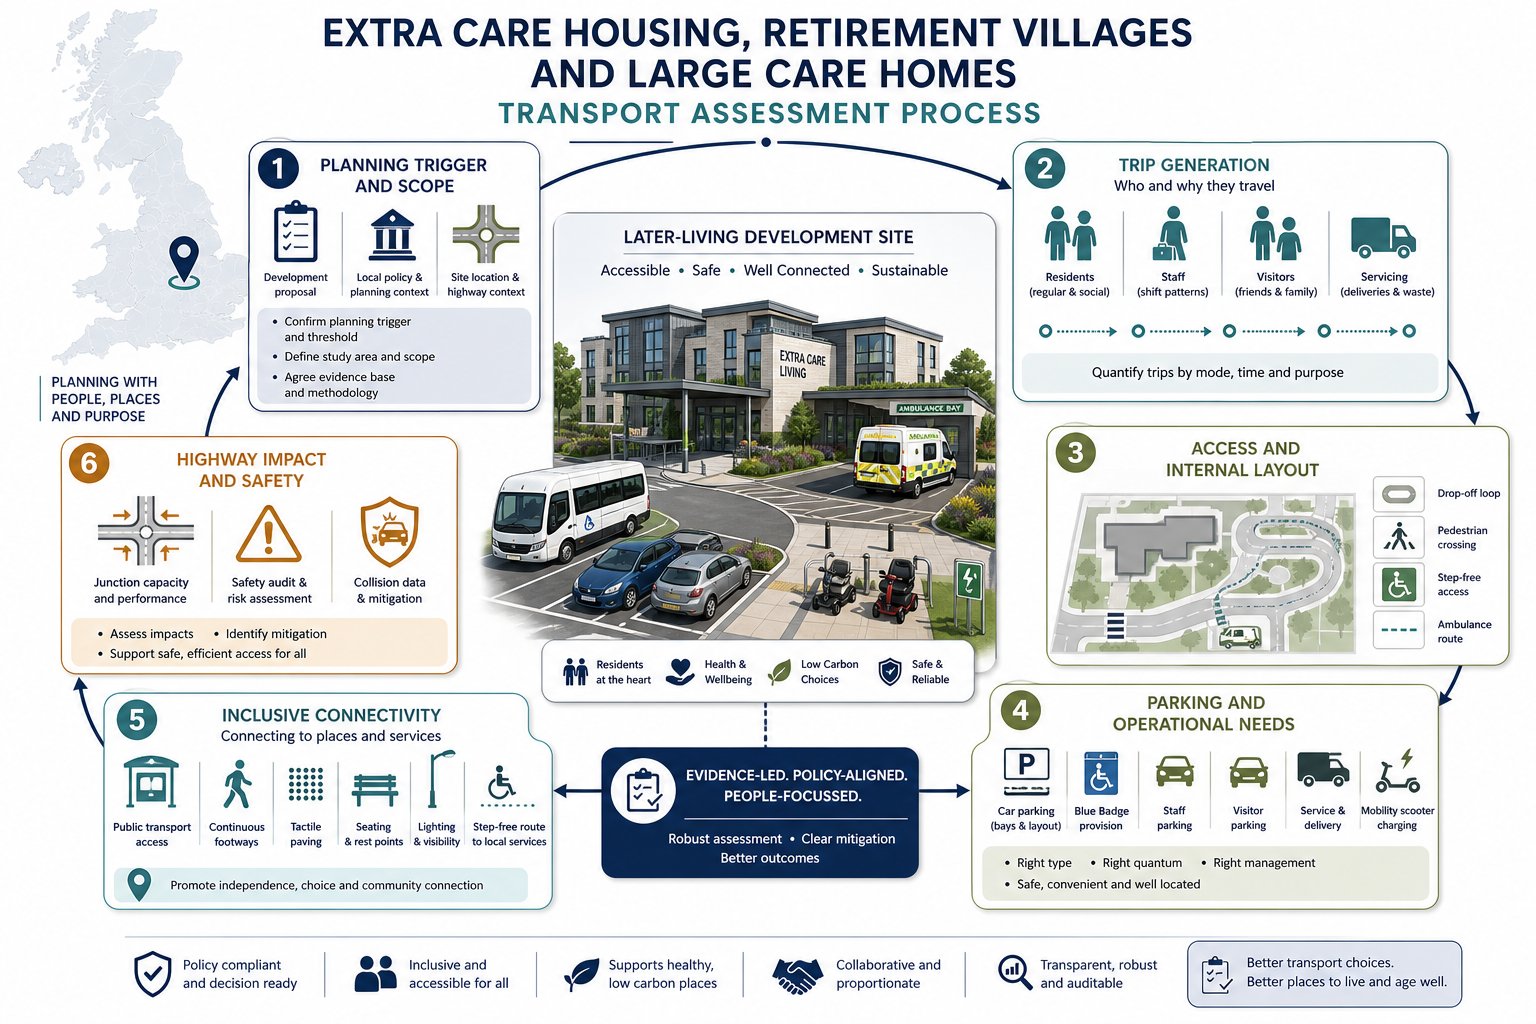
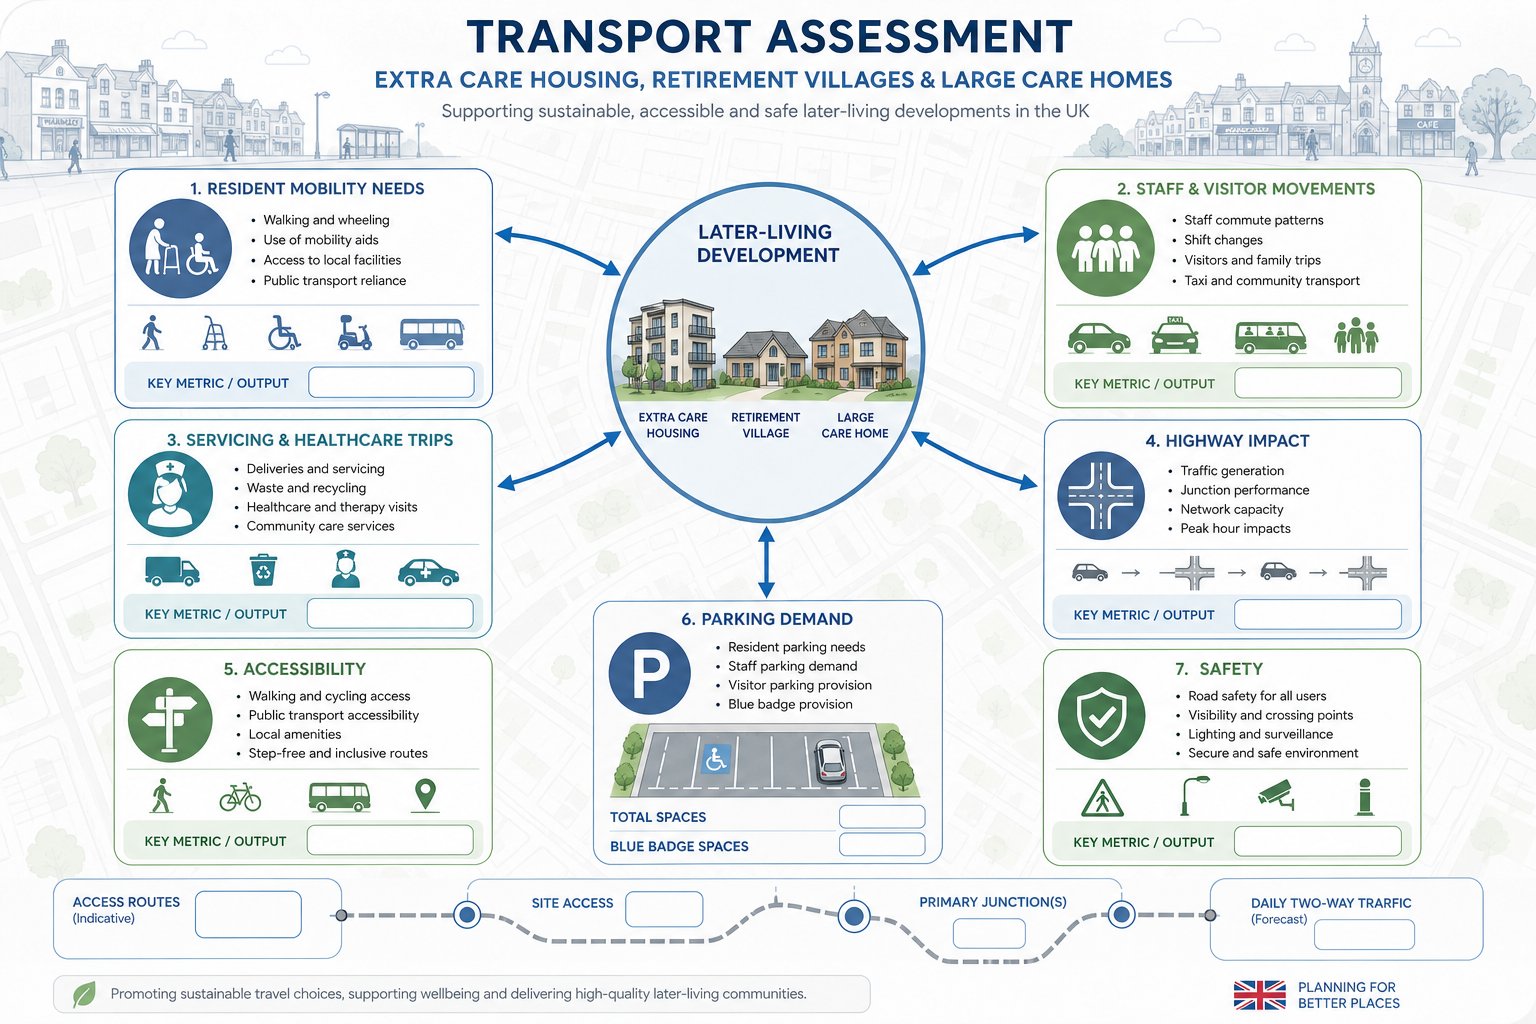
  • Extra Care Housing, Retirement Villages and Large Care Homes Transport Assessment: 2026 Planning Guide That Gets the Detail Right

    Extra Care Housing, Retirement Villages and Large Care Homes Transport Assessment: 2026 Planning Guide That Gets the Detail Right

    Planning for later living isn’t just about unit numbers, care models or architectural quality. On schemes such as extra care housing, retirement villages and large care homes, transport can become the quiet issue that either supports a smooth planning approval or triggers avoidable objections. Access for ambulances, staff shift arrivals, visitor parking, mobility scooter storage, step-free routes to nearby bus stops, these details carry real weight because they shape day-to-day life for residents who may be older, frailer, or less likely to drive regularly.

    That’s why an Extra Care Housing, Retirement Villages and Large Care Homes Transport Assessment needs a different lens from a standard residential appraisal. We have to look beyond typical commuter assumptions and focus on how residents, staff, visitors, healthcare professionals and servicing activity actually use a site. Local planning authorities increasingly expect that level of realism, especially where developments include communal facilities, operate around the clock, or sit on constrained highway networks.

    In this guide, we set out the practical issues that matter most in 2026: when a transport assessment is likely to be required, how trip generation differs from conventional housing, what highways officers usually examine, and what should go into a robust submission. For architects, planners, lawyers, surveyors, developers and councils, the aim is simple, to help shape transport evidence that is policy-aware, operationally credible and much easier to defend at application stage.

    Key Takeaways

    • An Extra Care Housing, Retirement Villages and Large Care Homes Transport Assessment must reflect the unique travel patterns of residents, staff, visitors and servicing activities, rather than relying on standard residential assumptions.
    • Accessibility is crucial; developments should provide step-free, well-lit routes to local services and public transport to support residents with varied mobility needs.
    • Parking strategies need to balance resident, staff, visitor and operational demands, including dedicated bays for mobility scooters, blue badge holders, and emergency vehicles.
    • Early engagement with local highway authorities helps define the scope and ensures realistic trip generation and impact assessments tailored to site-specific conditions.
    • Safe, clear internal layouts with direct pedestrian routes and suitable vehicle access are key to supporting the independence and wellbeing promises of later living schemes.
    • Robust transport assessments strengthen planning applications by integrating operational realities, accessibility, and safety, creating more defensible and policy-compliant submissions.

    Why Transport Assessments Matter For Later Living And Care Developments

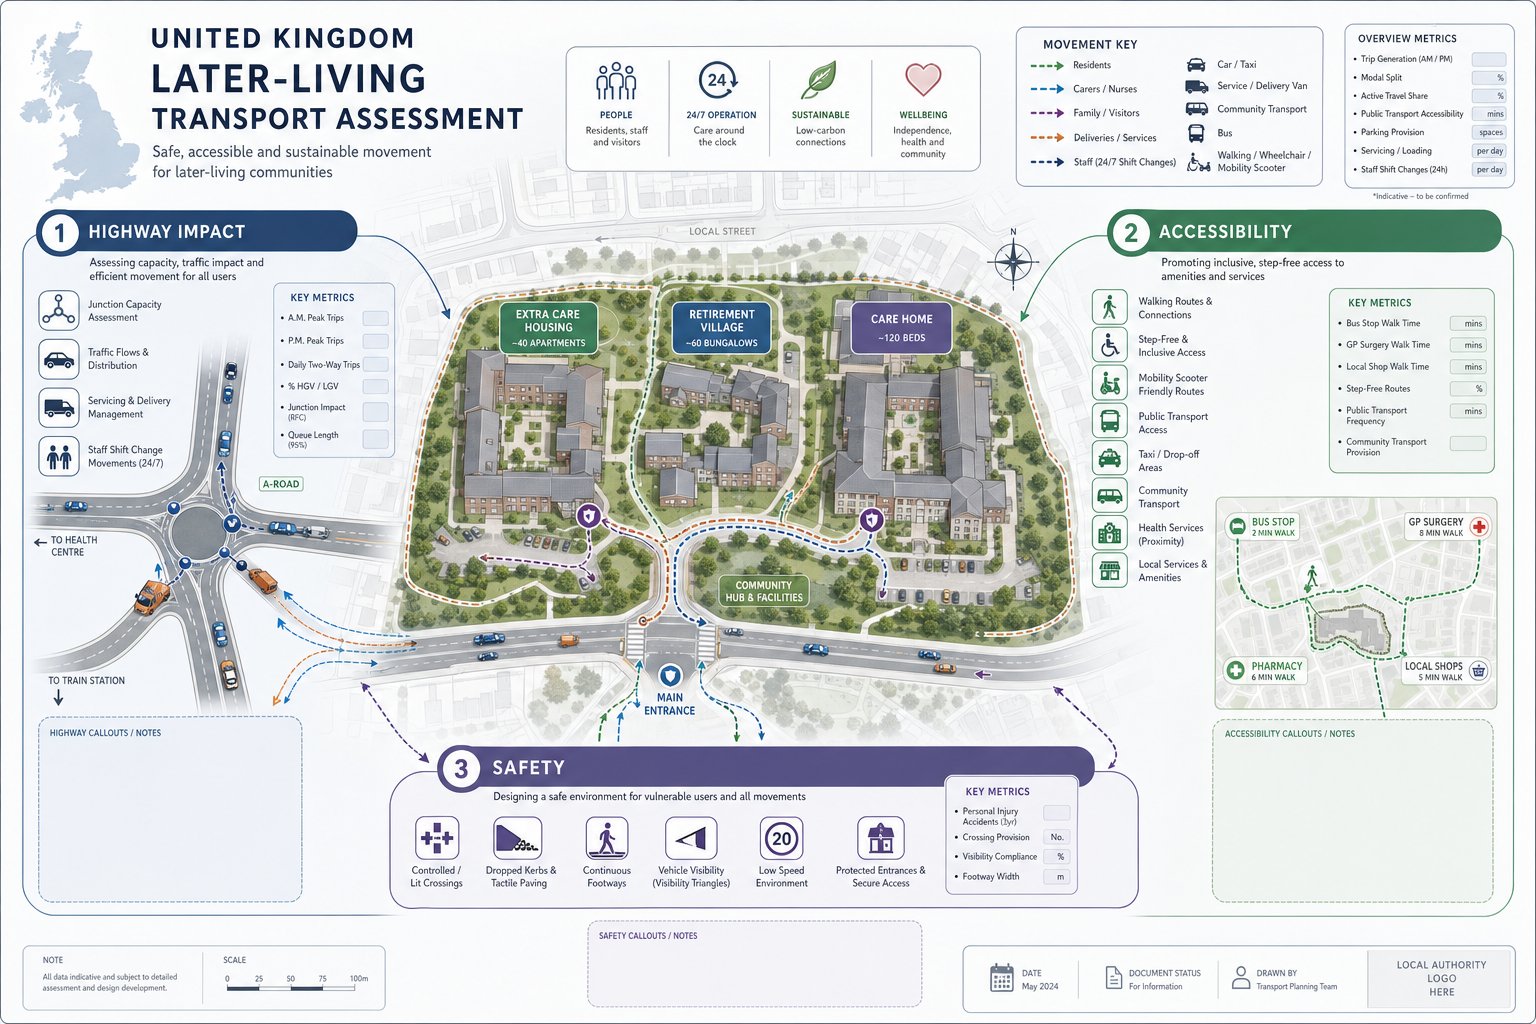
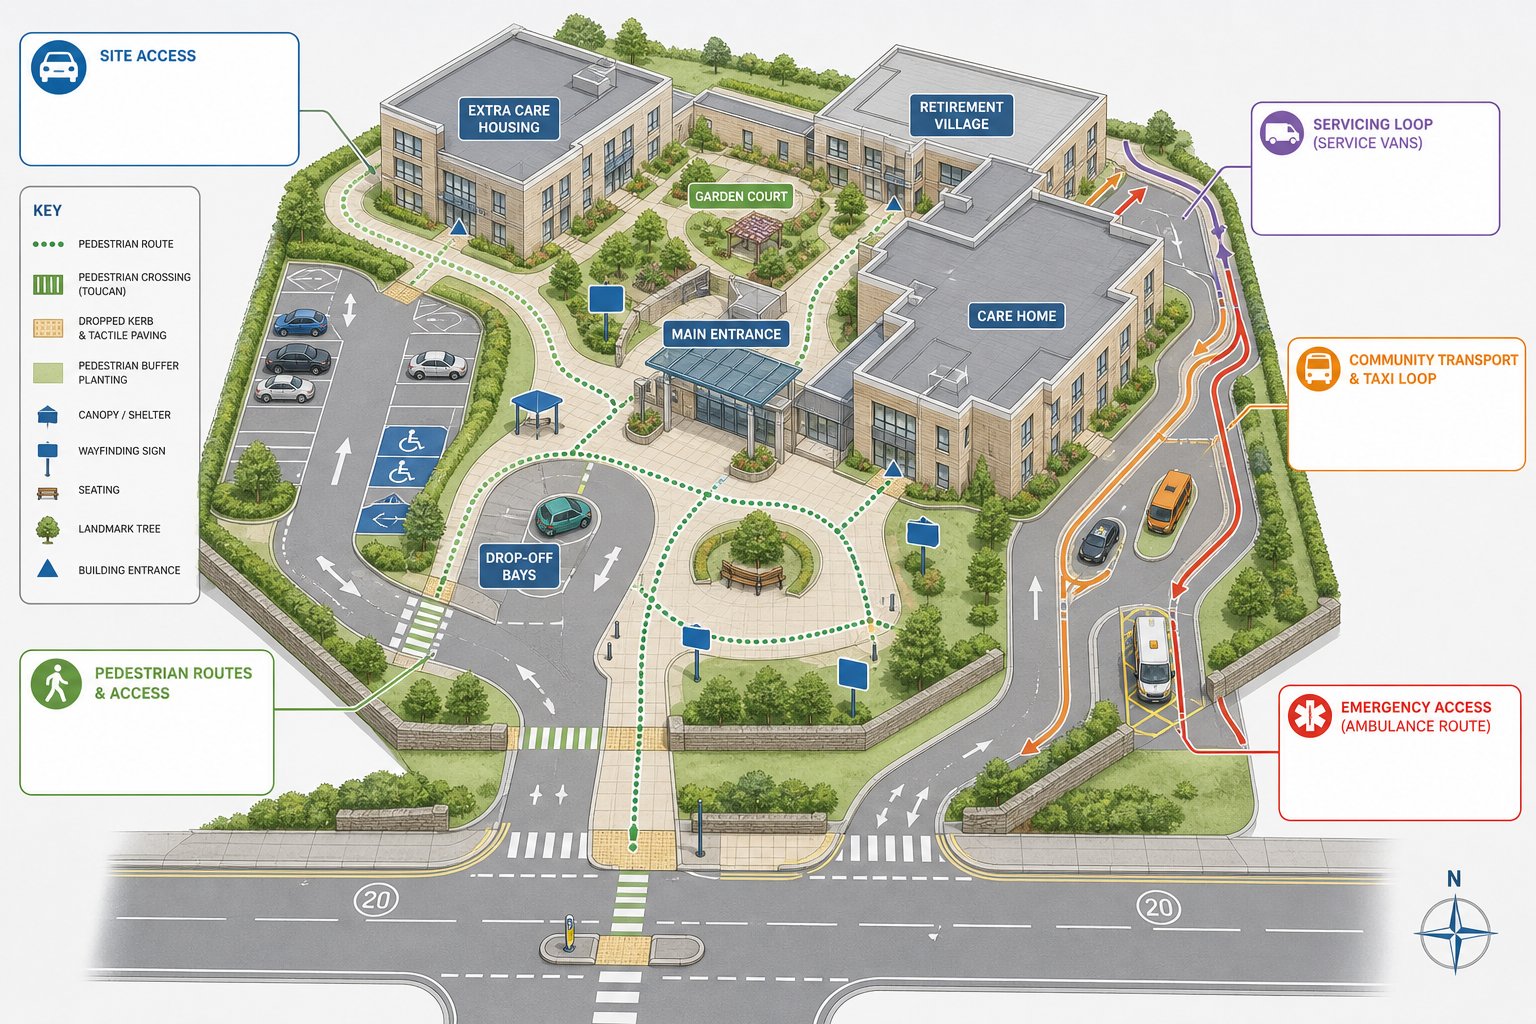
    Infographic of transport needs and planning factors for later living developments.
    Infographic showing transport needs for UK later living and care developments.

    Later living and care developments place transport considerations at the centre of planning in a way that many ordinary housing schemes simply do not. The reason is straightforward: residents often have more varied mobility needs, lower car ownership, and a greater reliance on walking aids, wheelchairs, mobility scooters, community transport, taxis and healthcare-related journeys. If the site doesn’t work safely and conveniently for those users, the development’s core promise, independent or supported living in a suitable setting, starts to weaken.

    Transport assessments matter because these schemes also generate movement patterns that are easy to underestimate. A retirement village may include communal dining, leisure space or wellness facilities. An extra care scheme may host carers, district nurses and frequent family visitors. A large care home may operate 24/7 with distinct staff shift changes and regular servicing. That means the transport case has to be grounded in how the development will actually function, not in generic residential assumptions.

    From a planning perspective, local authorities want confidence on three fronts: highway impact, accessibility and safety. They need to know whether nearby junctions can absorb traffic, whether parking demand has been properly considered, and whether residents can reach local services in an inclusive way. In practice, the strongest reports connect the transport story to the wider planning case. That broader approach is central to any solid transport assessment for planning applications, and it is especially important for later living proposals where independence and care provision sit side by side.

    When An Extra Care, Retirement Village Or Large Care Home Scheme Needs A Transport Assessment

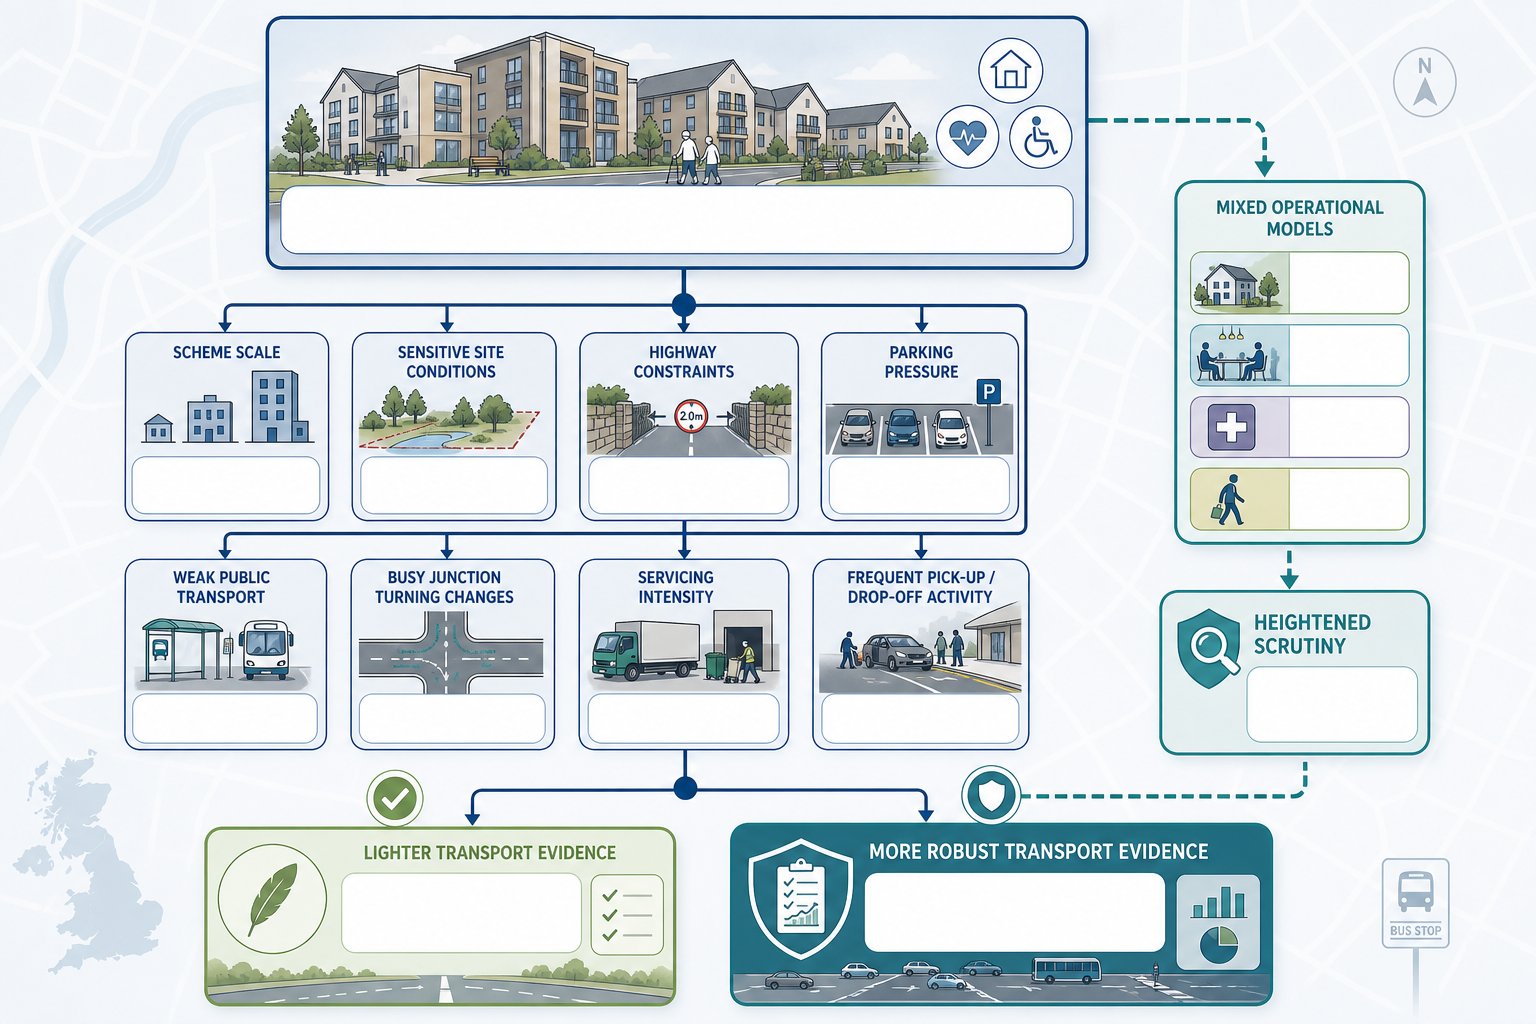
    Decision infographic showing triggers for transport assessment in later living developments.
    Decision infographic for when later living schemes need transport assessment.

    Not every later living development will require a full transport assessment, but many will need one, or at least a transport statement, once they reach a certain scale or sit in a sensitive location. In most cases, local thresholds set the starting point. Some highway authorities use broad triggers based on unit numbers or bedspaces, and larger extra care, retirement village or care home proposals often cross those thresholds quickly.

    Size, though, is only part of the picture. A smaller scheme can still need detailed transport evidence if it is accessed from a constrained junction, lies on a narrow frontage road, sits in an area with existing parking stress, or depends heavily on car travel because public transport and local services are weak. Equally, if the proposal is likely to change turning movements at a busy junction, intensify servicing, or create regular pick-up and drop-off activity, the authority may ask for a more robust assessment regardless of raw scale.

    We also find that mixed operational models tend to trigger more scrutiny. For example, a retirement village with communal facilities, healthcare space and staff presence can perform very differently from a typical apartment-led scheme. Where planning teams are unsure, early dialogue with the highway authority is worth the effort. It helps define scope, survey requirements and modelling expectations before positions harden. On wider projects, the same scoping discipline used in a Development Transport Assessment: practical planning exercise can prevent later disagreements about methodology, baseline conditions or what “material impact” really means.

    How Trip Generation Differs From Standard Residential Development

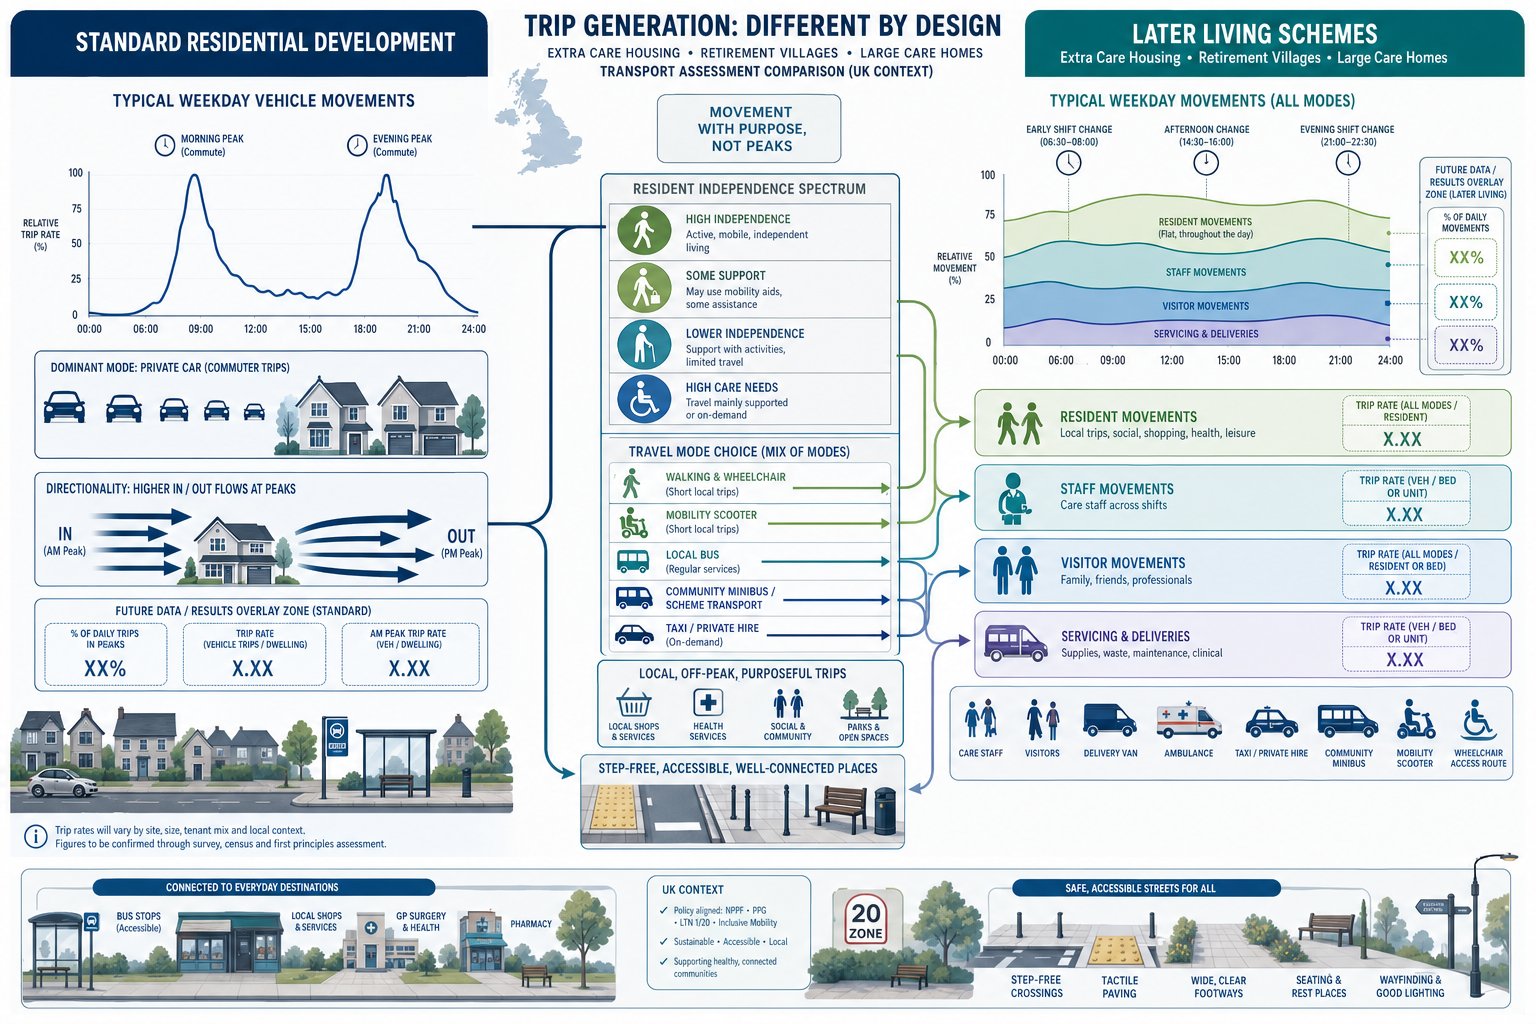
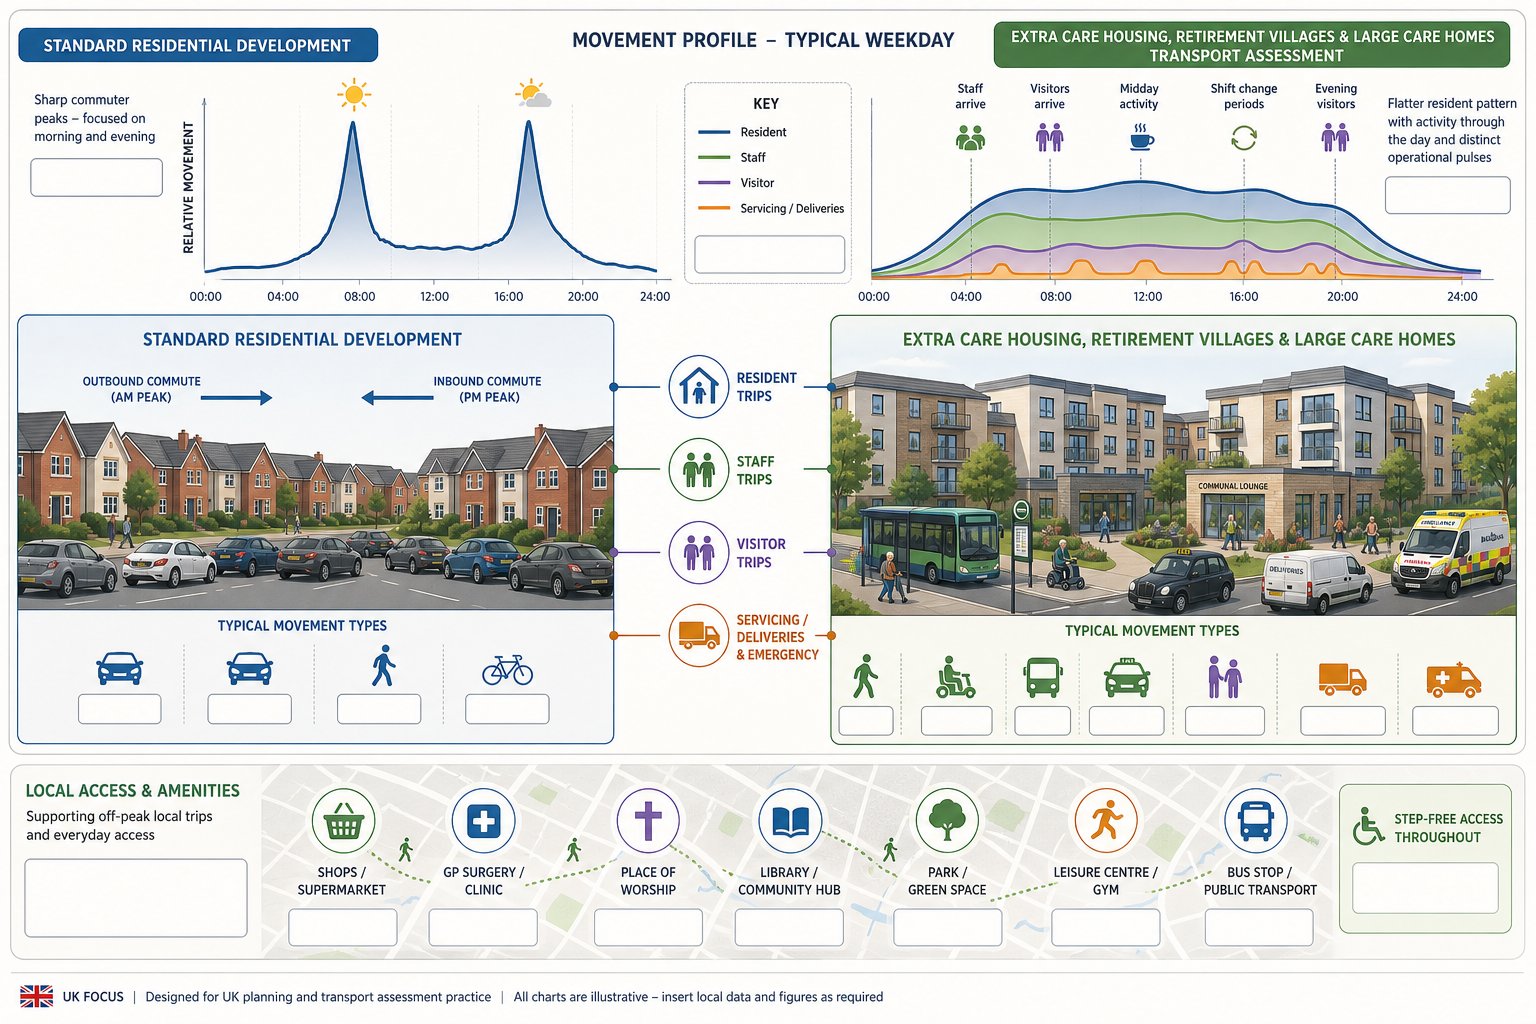
    Comparison of standard housing and later living transport trip patterns in the UK.
    Comparison of standard housing peaks and later living transport movement patterns.

    Using suburban housing trip rates for later living schemes is one of the most common mistakes in planning submissions. An extra care housing, retirement villages and large care homes transport assessment has to reflect the operational reality of the proposal. Resident travel demand is often lower in car terms, but that does not mean overall movement is negligible. It is simply made up differently.

    In standard residential development, peak demand tends to be tied to commuter departures in the morning and returns in the evening. Later living schemes usually show a flatter resident profile, but more staff-related, visitor-related and servicing-related movements. That changes not just the number of trips, but their timing, mode split and operational impact.

    Resident Travel Patterns And Levels Of Independence

    Residents in extra care and retirement settings are not a uniform group. Some drive regularly and maintain active social lives: others travel with support or depend on lifts, community transport, taxis or mobility scooters. Many make short local trips during off-peak periods for shopping, appointments, worship, leisure or simply to stay connected with the surrounding neighbourhood.

    That has two implications for assessment work. First, lower resident car trip rates do not remove the need for good accessibility. Quite the opposite: the less residents drive, the more important nearby shops, services, bus stops and step-free walking routes become. Second, trip generation should be informed by comparable later living sites where possible, rather than broad residential databases alone. On schemes with self-contained units, it can still be useful to sense-check assumptions against a Residential Development Transport evidence base, but only as a secondary reference, not the headline comparator.

    Staff, Visitors, Servicing And Shift Change Movements

    The bigger transport story often sits with non-resident demand. Staff travel can be substantial, especially where care is provided around the clock. Early morning, afternoon and evening shift changes create short bursts of arrivals and departures that do not mirror standard housing peaks. Visitor patterns can be broad too, often concentrated in daytime and early evening periods, with weekend intensity in some schemes.

    Then there is servicing: food deliveries, laundry, medical supplies, waste collection, maintenance teams, patient transport and, at times, ambulance access. If communal facilities are open to non-residents, movement can increase again. A realistic assessment should separate these components rather than bundling them into a single “background operational traffic” figure. That level of granularity gives local planning authorities far more confidence that the proposed highway and parking strategy is built on how the site will actually run.

    Key Transport Issues Local Planning Authorities Usually Examine

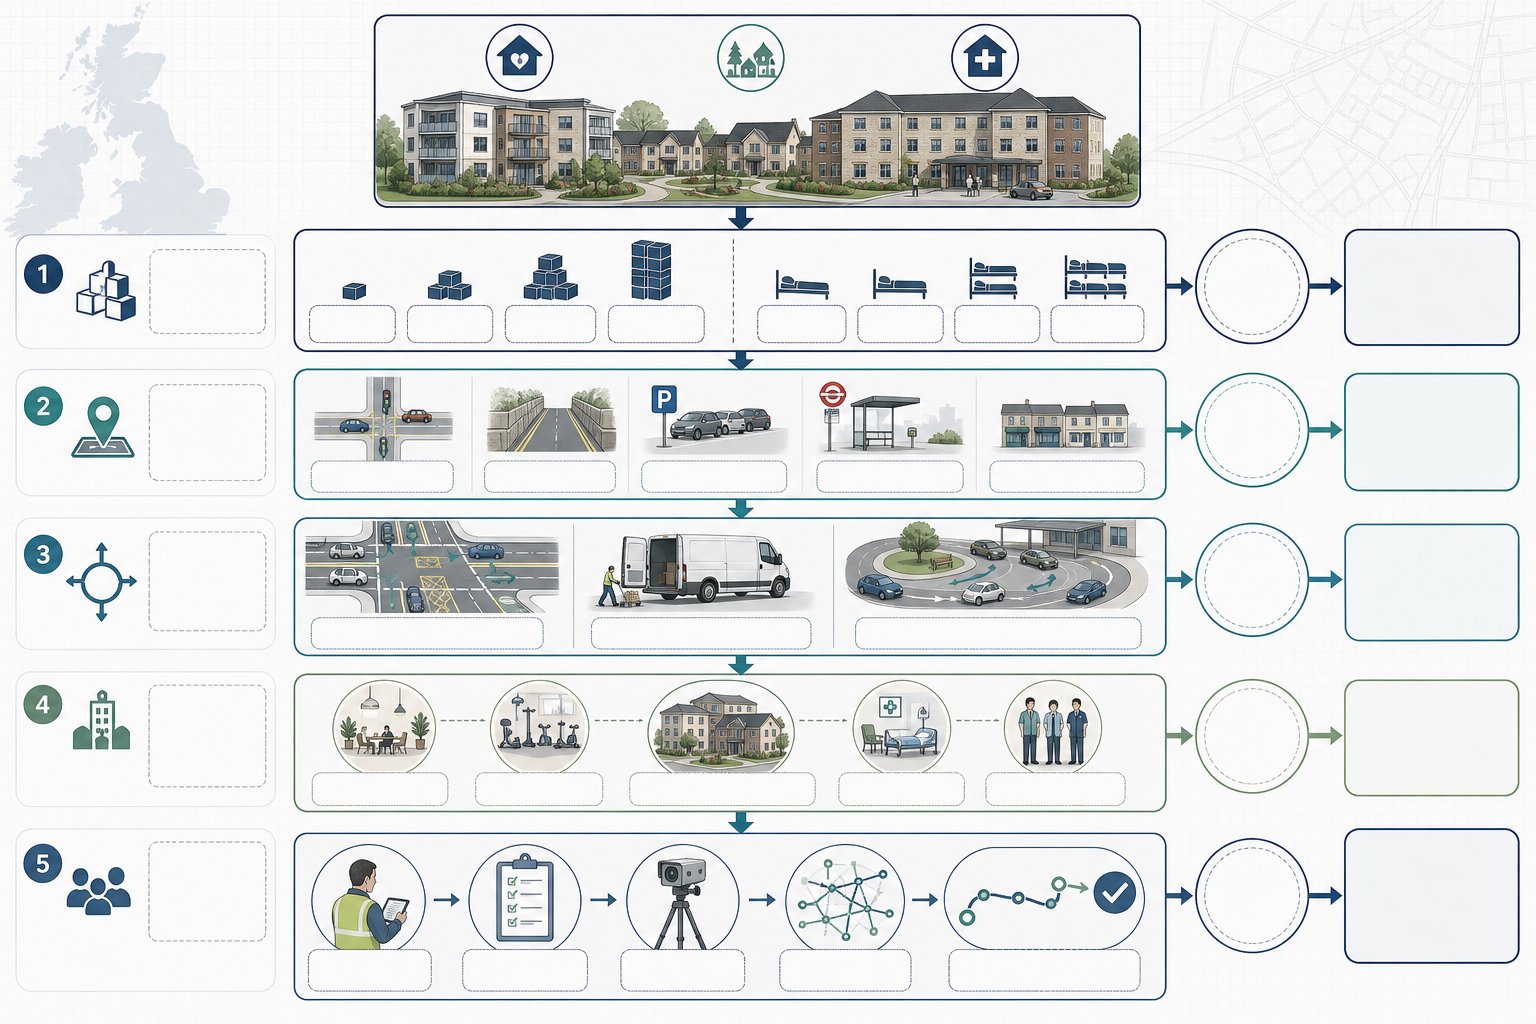
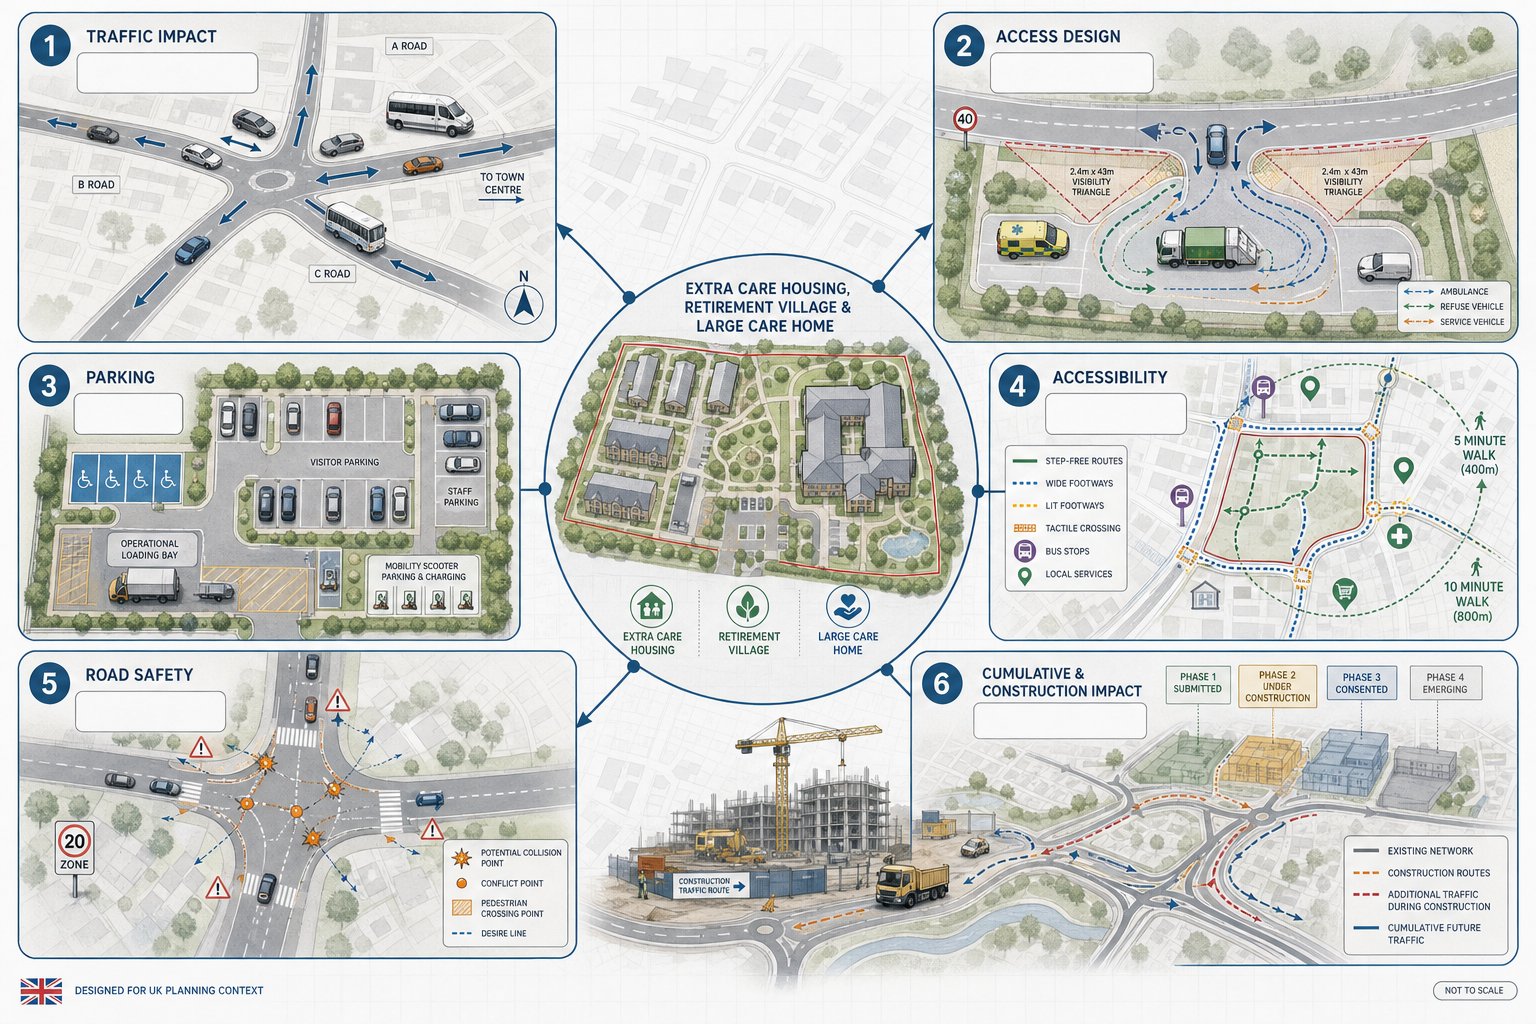
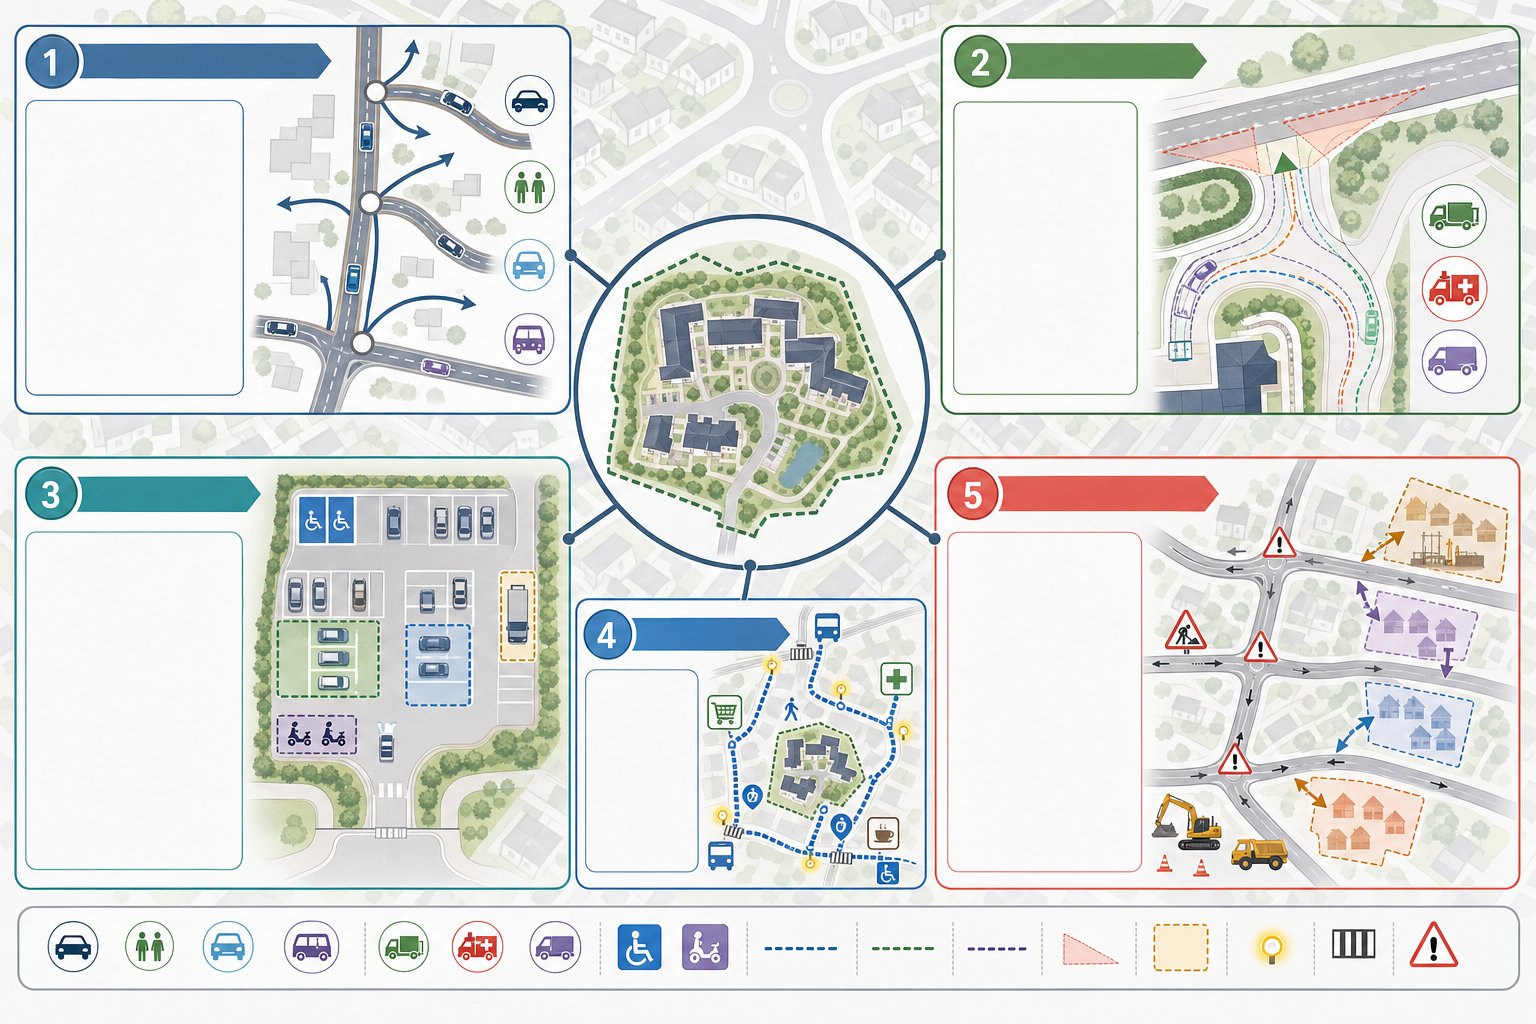
    Infographic of key transport issues for later living developments in the UK.
    Infographic of key transport checks for later living developments in the UK.

    Highway officers and planning teams tend to focus on a familiar set of questions, but later living schemes add a sharper edge to each one. First is traffic impact: how many vehicle movements will the development generate, where will they route, and will nearby junctions continue to operate acceptably? Because these developments often have lower resident car use but stronger staff and visitor demand, the quality of the trip generation evidence matters as much as the totals.

    Second is access design. Authorities will look closely at whether vehicles can enter and leave safely, whether visibility is appropriate, and whether the access arrangement works for refuse vehicles, minibuses, ambulances and occasional larger servicing vehicles. Third is parking: not just headline numbers, but the balance between staff, visitors, blue badge holders, operational bays and mobility scooter provision.

    Accessibility is another major theme. Can residents reach local services on foot or by wheelchair? Are bus stops realistic to use for older people? Are routes well lit, step-free and easy to understand? For proposals with more complex land uses or extensive communal facilities, lessons from mixed use masterplan planning can be surprisingly relevant, because the authority is often reviewing a small operational ecosystem rather than a simple residential block.

    Finally, local authorities will examine road safety, collision history, construction traffic and cumulative impact with nearby allocations. A scheme may look acceptable in isolation but become more sensitive when added to other consented development. Robust transport work anticipates those questions rather than waiting for them to appear in consultation responses.

    Access, Internal Layout And Safe Movement Around The Site

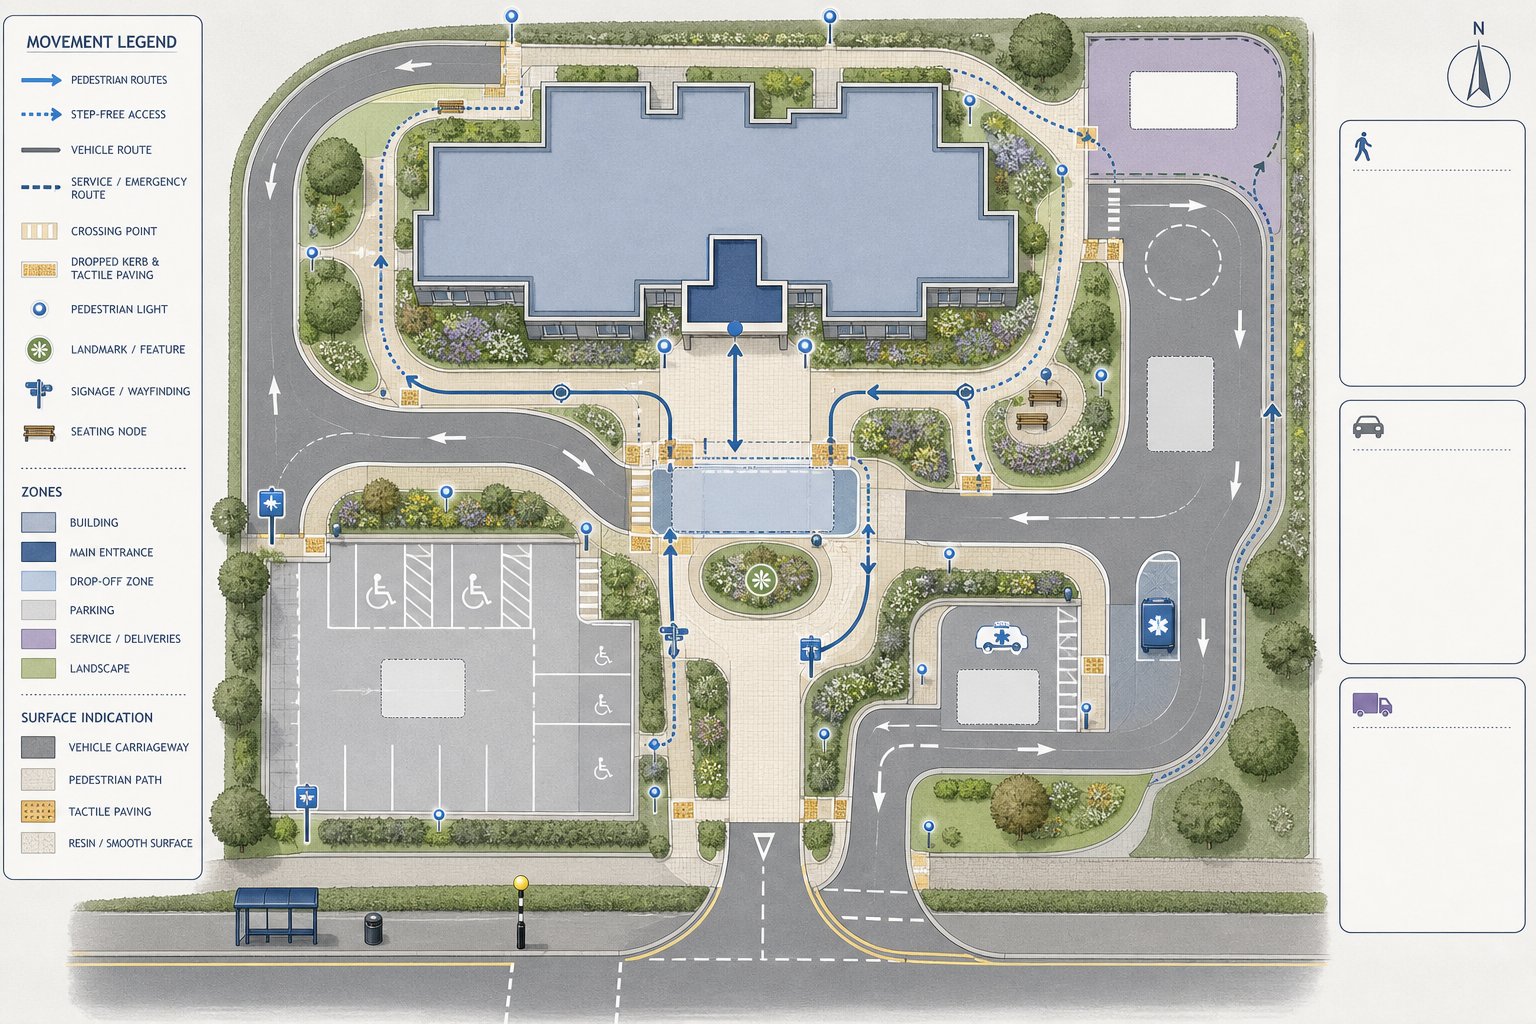
    Site layout showing safe pedestrian and vehicle movement around a care development.
    Infographic of a care site with safe paths, drop-off zones, and vehicle routes.

    A technically acceptable access point is only the start. On later living and care schemes, the internal layout is just as important because daily movement on site may involve residents with reduced mobility, visiting family members, carers, delivery drivers and emergency vehicles all using the same environment.

    The best layouts are simple, legible and forgiving. Main pedestrian routes should be direct, step-free and well lit, with dropped kerbs, tactile paving where appropriate, generous widths and obvious crossings. If residents use wheelchairs or mobility scooters, pinch points quickly become more than an inconvenience: they can become barriers to independence. The route from parking areas and drop-off points to the main entrance should hence feel effortless, not merely compliant.

    Vehicle circulation also needs care. Servicing and ambulance access should be possible without awkward reversing, conflict with pedestrian desire lines or obstruction of the principal entrance. Dedicated pick-up and drop-off space matters more than many applications initially assume, particularly where community transport or taxis are part of the site’s day-to-day operation.

    And clarity counts. Straightforward signage, recognisable landmarks and uncomplicated geometry can make a real difference for users living with visual impairment or cognitive decline. Where changes to site access or internal roads are more involved, related technical work such as environmental impact assessment transport analysis may also become relevant, especially if highway changes interact with a wider planning package or sensitive surroundings.

    Parking Provision For Staff, Visitors And Operational Needs

    Parking on later living schemes is rarely about applying a simple ratio and moving on. Resident parking demand is often lower than on standard housing sites, but that reduction does not eliminate the need for carefully planned provision. Some residents will still drive. Others may have regular visitors arriving by car. And operational demand, staff, healthcare professionals, deliveries, minibuses, ambulances, can easily dominate the picture.

    Staff parking is frequently the pressure point. Shift changes can produce concentrated demand, especially where public transport is limited or staffing patterns start outside normal bus operating hours. Under-provision in these circumstances tends to spill into neighbouring streets, which is exactly the kind of issue that prompts objection from residents and scrutiny from highway officers.

    Visitor parking also needs realism. Family visits are integral to wellbeing, and schemes that make visiting awkward can generate informal stopping close to entrances or on access roads. Dedicated accessible bays near the entrance, along with spaces for GPs, district nurses and other mobile professionals, should usually be identified separately.

    Beyond car parking, a credible strategy should address mobility scooter storage and charging, cycle parking for staff and visitors, and any operational lay-bys or service bays. Where parking management will be needed, permits, staff allocation, overspill controls or timed operational bays, that should be set out clearly. Vague references to “management by the operator” rarely reassure decision-makers.

    Walking, Wheelchair Access, Public Transport And Inclusive Connectivity

    For later living development, accessibility is not a supporting chapter. It is one of the main tests of whether the location is suitable at all. A site may have acceptable highway access in pure engineering terms, but if residents cannot comfortably reach everyday destinations or nearby public transport, the planning case is weaker.

    Walking routes should be continuous, level where possible, well maintained and easy to navigate. For older residents, a route that looks short on a plan can be effectively inaccessible if it includes steep gradients, uneven surfaces, missing dropped kerbs or fast crossings with limited refuge. Wheelchair users and mobility scooter users face the same issue, often more sharply.

    Public transport appraisal should go beyond counting bus stops within a set radius. We need to ask whether the route to the stop is genuinely usable, whether shelters and seating are present, whether services run at times that suit staff and visitors, and whether destinations connect to town centres, hospitals and local facilities. For many schemes, community transport and dial-a-ride services are part of the real mobility picture and deserve explicit mention.

    Inclusive connectivity also means creating an environment that residents can understand and trust: good lighting, landmarks, resting points and crossings that do not feel hostile. In practice, the accessibility chapter is where planning policy, design quality and transport evidence come together most clearly.

    Highway Impact, Junction Capacity And Peak Period Assessment

    Highway impact assessment for later living schemes needs a tailored peak-period approach. If we only examine conventional weekday commuter peaks, we can miss the periods that actually matter. Staff shift changes, visitor arrivals, servicing windows and school-run interaction on surrounding roads may all be more relevant than a standard residential 08:00 network stress point.

    That starts with a sound baseline: existing traffic flows, turning counts, nearby consented development, local collision history and an honest reading of how the surrounding road network performs today. From there, trip generation and distribution should reflect the proposed operation, not generic assumptions. A good report will explain why the selected peaks have been tested and how they relate to staffing patterns and likely visitor behaviour.

    Where junction modelling is required, authorities will expect transparent inputs and sensible sensitivity testing. For many teams, tools such as Junctions 11 Software form part of that analysis, but the software output is only as persuasive as the traffic assumptions behind it.

    If access alterations are proposed, road safety should be considered alongside capacity. A marginally acceptable junction in operational terms may still perform poorly for vulnerable pedestrians if crossings, visibility or vehicle speeds are not handled well. On schemes serving older residents, that balance between capacity and safety is especially important.

    What A Robust Transport Assessment Should Include

    A robust transport assessment for extra care housing, retirement villages and large care homes should begin with a precise description of the proposal: unit numbers or bedspaces, care model, staffing levels, shift arrangements, communal facilities, servicing requirements and any healthcare or public-facing uses. Without that operational context, the technical analysis floats free of reality.

    The baseline section should cover existing highway conditions, accessibility by all modes, nearby services and known constraints. For later living schemes, it is particularly important to document footway quality, gradients, crossing provision, public transport realism and the practical experience of wheelchair users or less confident pedestrians.

    Trip generation should then be broken down by residents, staff, visitors and servicing, ideally drawing on comparable sites as well as recognised databases. Distribution assumptions need to be explained, not guessed. If junctions are sensitive, capacity testing should be proportionate and transparent. Parking demand should be assessed with the same discipline, including staff peaks, visitor demand, blue badge needs, operational vehicles and mobility scooter provision.

    A robust submission should also include access and internal layout plans, swept paths where required, and a travel plan that reflects the actual user group. That might mean staff car-sharing, public transport information, community transport coordination, cycle provision for staff, and practical measures to support non-car access for visitors. In broader planning packages, alignment with a Development Transport Assessment: wider framework or even environmental impact assessment transport: linked material can help keep the evidence consistent across disciplines.

    Common Planning Risks And How To Strengthen An Application

    The most common planning risk is underestimating how the development actually operates. Staff trips are often too low. Visitor demand is treated as an afterthought. Servicing is reduced to a sentence. Then the local authority, neighbours or both spot the gap immediately. Once confidence in the transport evidence slips, it can affect the whole application.

    Another regular weakness is overstating accessibility. A bus stop within distance on paper does not necessarily mean a resident with limited mobility can use it safely. If the route is steep, poorly lit or interrupted by missing dropped kerbs, the site may appear far less sustainable than the application suggests. Parking can be another fault line, particularly where shift-change demand pushes staff cars into surrounding streets.

    Strengthening an application usually starts with early engagement and better evidence. We are far better placed when we scope the work with the highway authority, use survey data from comparable later living schemes, and explain assumptions in plain language. That same disciplined approach underpins successful transport assessment for developments: planning work generally.

    It also helps to show how transport design supports the development’s social purpose. If residents can move safely around the site, visitors can park without conflict, servicing is properly managed and nearby facilities are genuinely accessible, the transport case becomes much more persuasive. For planning teams needing concise, authority-aware reporting, that is where experienced advice can make the difference between a technically adequate submission and one that feels decision-ready.

    Conclusion

    An effective Extra Care Housing, Retirement Villages and Large Care Homes Transport Assessment is not about forcing a specialist development into standard housing assumptions. It is about understanding how later living really works: lower resident car use in many cases, but more staff travel, more operational activity, stronger accessibility needs and a much sharper focus on safe, inclusive movement.

    For architects, planners, developers, lawyers and councils, the best outcomes usually come from treating transport as part of the scheme design from the outset rather than a report to commission at the end. When trip generation is realistic, parking is operationally grounded, walking and wheelchair access are properly tested, and highway impacts are assessed against the right peaks, planning discussions become much more constructive.

    In 2026, that practical credibility matters. Authorities want evidence that is proportionate, locally aware and tailored to the people who will actually live, work and visit on the site. If the transport story is clear and defensible, the wider planning case is almost always stronger.

    Frequently Asked Questions about Transport Assessments for Later Living Developments

    Why are transport assessments important for extra care housing and retirement villages?

    Transport assessments ensure safe and convenient access for residents, staff, visitors and healthcare professionals, reflecting varied mobility needs and operational patterns unique to later living developments, thus supporting independent living and easing planning approvals.

    When is a transport assessment typically required for large care home or retirement schemes?

    A transport assessment is usually needed for schemes exceeding local thresholds (often over 50–80 units or beds), or when the development may significantly impact junctions, parking demand or public transport accessibility on constrained or sensitive sites.

    How does trip generation for extra care housing differ from standard residential developments?

    Extra care housing has lower resident car use but higher trips from staff shifts, visitors and servicing. Movement patterns are more spread out with distinct shift-change peaks, unlike typical commuter peaks seen in standard housing schemes.

    What key transport issues do local planning authorities focus on in these assessments?

    Authorities assess traffic volumes versus junction capacity, site access design and safety, parking provisions including for mobility scooters and disabled users, quality of walking routes, public transport accessibility, and cumulative impacts with nearby developments.

    How should parking be planned for staff, visitors and residents in retirement villages and care homes?

    Parking provision must meet realistic demand for lower resident car use but substantial staff and visitor needs, including dedicated accessible bays, staff parking at shift peaks, and storage with charging for mobility scooters and cycles.

    What features make walking and wheelchair access suitable for later living developments?

    Suitable access involves step-free, continuous, level, well-lit routes with dropped kerbs and tactile paving, plus accessible bus stops with shelters and seating. Inclusive connectivity also means legible paths with resting points to assist residents with sensory or cognitive impairments.

  • Purpose-Built Student Accommodation Transport Assessment: What Planning Teams Need To Get Right In 2026

    Purpose-Built Student Accommodation Transport Assessment: What Planning Teams Need To Get Right In 2026

    Student accommodation can look deceptively simple from a transport perspective. Fewer private cars, central locations, and a resident population that usually walks, cycles or takes the bus, on paper, that sounds easier than a standard residential scheme. In practice, it rarely is. A Purpose-built Student Accommodation Transport Assessment has to deal with highly concentrated move-in weekends, sharp term-time travel patterns, local authority parking concerns, campus connectivity, servicing constraints, and policy tests that are often far more specific than applicants first expect.

    That matters because PBSA schemes are now under closer scrutiny in many university towns and cities. Councils want robust evidence that car-free or car-lite claims will hold up in the real world. Universities want schemes that genuinely connect to campus. Highway authorities want confidence that access, servicing and arrivals can be managed without spilling onto already stressed streets.

    In our experience, the strongest reports are the ones that treat student accommodation as its own transport typology, not as a cut-down apartment assessment. They use student-specific trip generation, realistic mode share assumptions, and practical management measures that planners can actually condition and enforce. In this guide, we set out what planning teams need to get right in 2026, from scope and policy through to move-in management and common technical risks.

    Key Takeaways

    • A Purpose-built Student Accommodation Transport Assessment must address unique student travel patterns, including concentrated move-in periods and term-time peaks, rather than treating student housing like conventional residential developments.
    • Robust PBSA transport assessments rely on student-specific trip generation and realistic mode share assumptions supported by local surveys, university data, and relevant census information.
    • Effective management plans for move-in, move-out, and servicing are critical to prevent local street congestion and must include staggered arrivals, clear communication, and enforcement mechanisms.
    • Sustainable transport connections such as safe pedestrian and cycle routes, frequent public transport, and close campus proximity are fundamental to successful PBSA schemes and low car dependency.
    • Car parking strategies in PBSA schemes should be credible and enforceable, including strong tenancy restrictions to support car-free or car-lite operation while providing accessible Blue Badge parking.
    • Early engagement with highway authorities and stakeholders is essential for appropriate scope, avoiding last-minute objections, and producing a focused, locally tailored transport assessment.

    What A Purpose-Built Student Accommodation Transport Assessment Covers

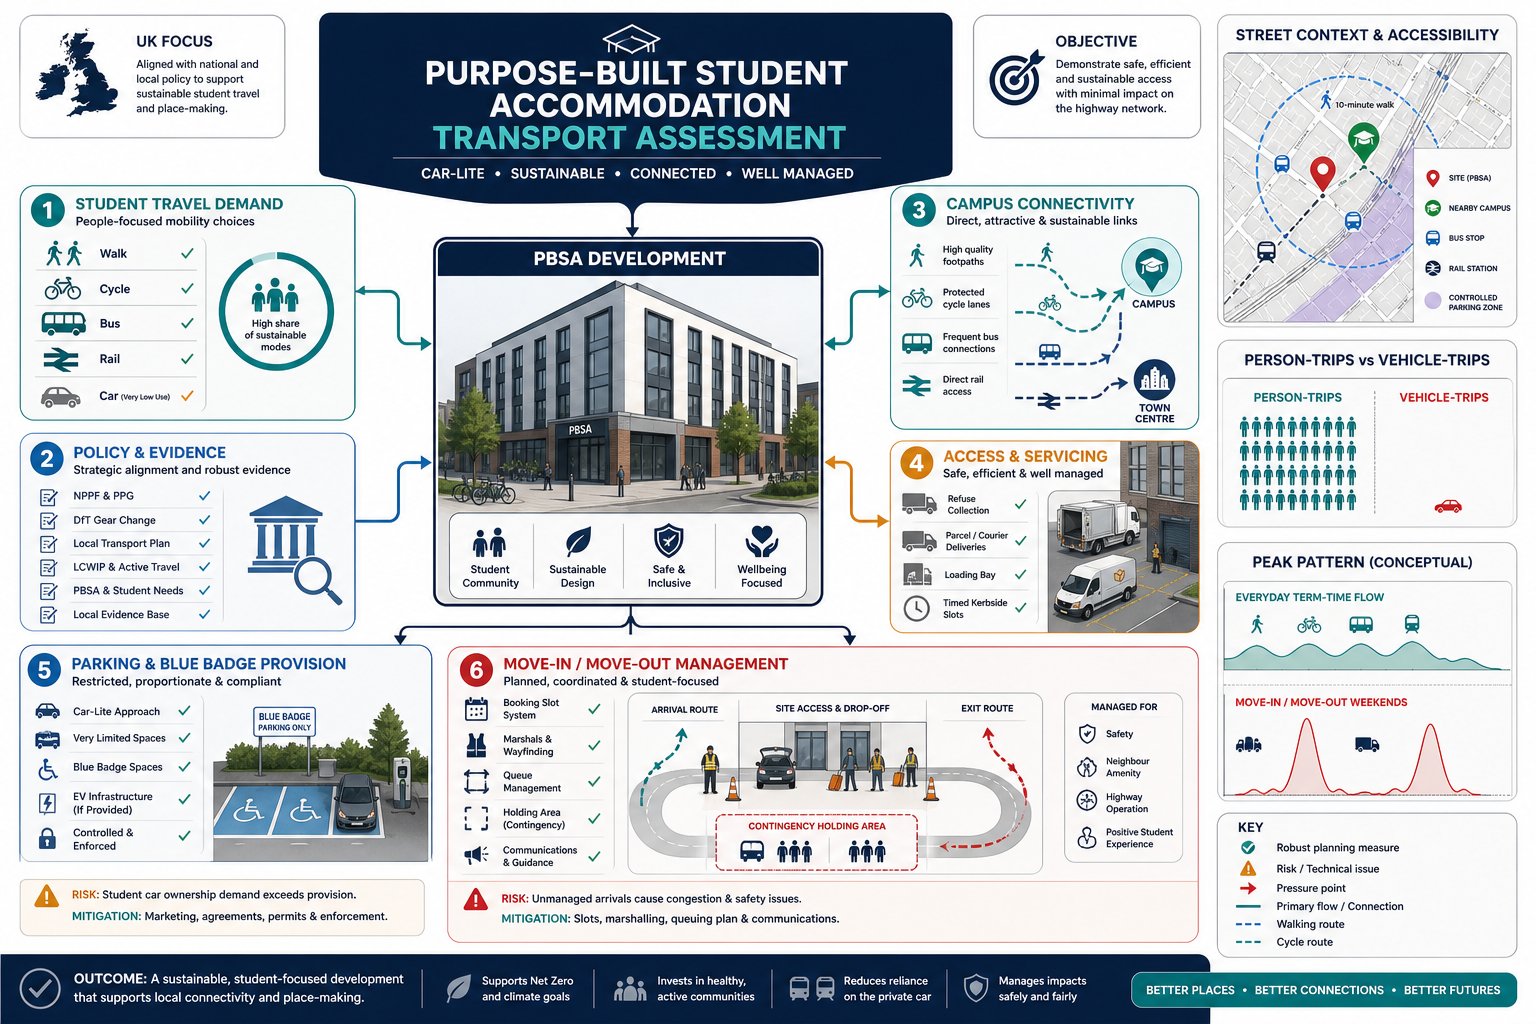
    Infographic of key elements in a UK student housing transport assessment.

    A Purpose-built Student Accommodation Transport Assessment should do more than confirm that students are less car-dependent than typical households. It needs to explain, with evidence, how the scheme will function day to day and at its pressure points.

    At minimum, we would expect it to cover development quantum, room types, likely student profile, site context, and the relationship to campus, town centre and local services. It should then move into the transport fundamentals: person-trip generation, mode share, access strategy, highway effects, parking, cycle provision, and servicing.

    For PBSA, management detail matters unusually early. That means the assessment often needs to address move-in and move-out operations, delivery activity, refuse collection, maintenance access, and the practical mechanics of any car-free strategy. If those points are left vague, objections usually follow.

    Just as importantly, the report should align with the wider planning evidence base. On larger schemes, the PBSA assessment may sit alongside a broader Development Transport Assessment: A approach, and sometimes interacts with an environmental impact assessment where traffic, air quality or cumulative effects are sensitive.

    Done properly, the document becomes a planning tool, not just a technical appendix. It shows that student travel demand, access and operations have been thought through in a way that is credible to officers, highway authorities and committees.

    When A Transport Assessment Is Needed For Student Accommodation

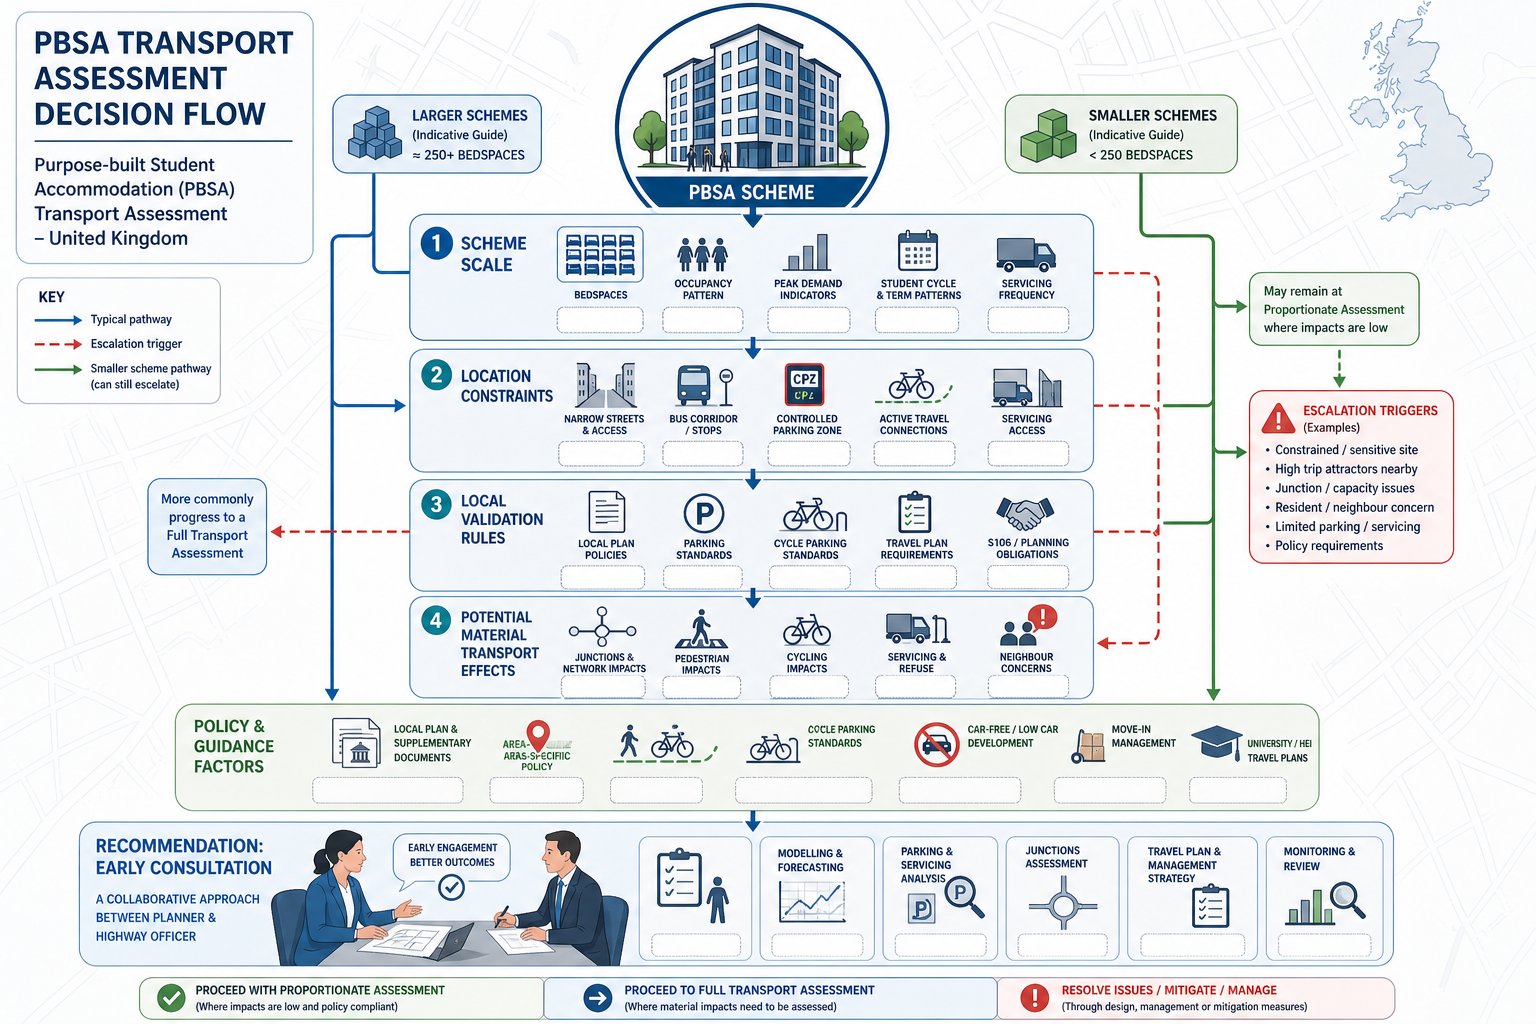
    UK infographic showing when student accommodation needs a transport assessment.

    There is no single national threshold that captures every PBSA proposal. In practice, whether a transport assessment is required depends on scale, location, local validation requirements, and the likelihood of material transport effects.

    Major schemes are the obvious candidates. In many authorities, developments above roughly 50 to 80 bedspaces will trigger at least a transport statement, and often a full assessment if access, servicing, parking stress or junction performance could become contentious. But smaller proposals can still require detailed transport work where the site sits on constrained streets, near busy bus corridors, within controlled parking zones, or in locations with a history of overspill and neighbour concern.

    We also see requirements arise where local plan policy treats PBSA as a distinct use class in practical terms, even if the planning route is broader. Some councils have supplementary guidance on student housing location, cycle standards, car-free expectations or move-in management. In those cases, a generic note won’t be enough.

    The safest approach is to agree scope early with the highway authority and case officer. That avoids the familiar problem of submitting a slim report, only to be asked later for surveys, junction modelling, parking analysis and management plans. For teams working across sectors, the principles are similar to a broader transport assessment for planning application, but PBSA usually needs sharper assumptions about student behaviour and term-time variation.

    How PBSA Travel Demand Differs From Conventional Residential Development

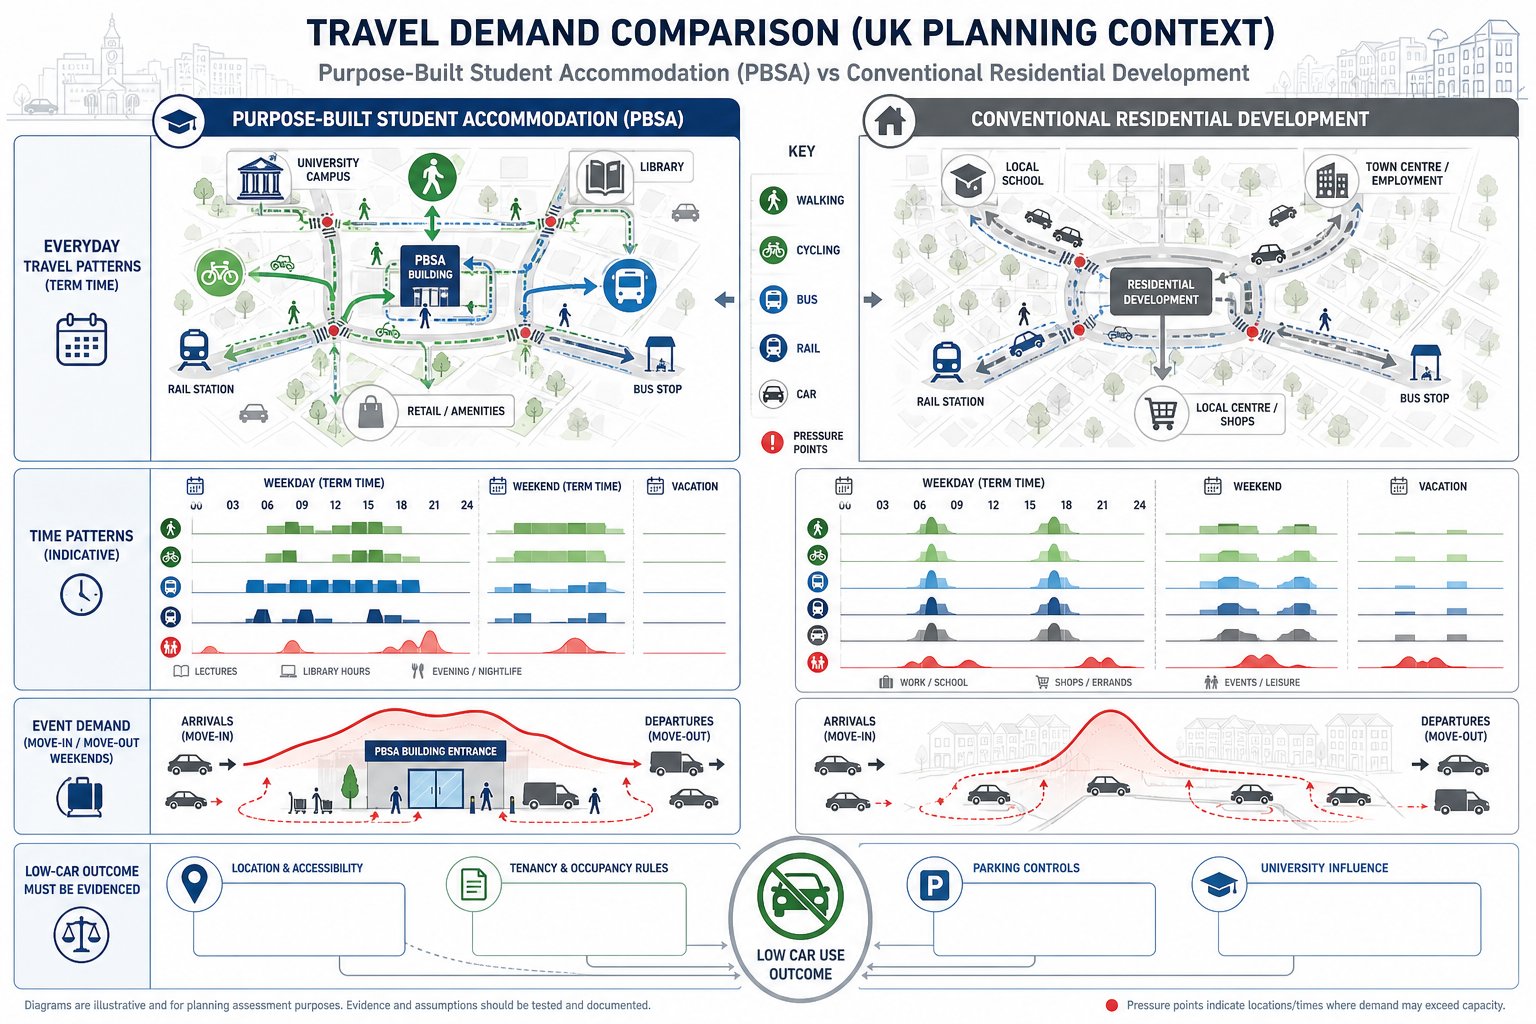
    Infographic comparing student housing travel patterns with conventional residential development in the UK.

    This is where many assessments either win credibility or lose it.

    A student accommodation scheme is not simply a flat block with lower parking demand. Its travel behaviour is structurally different. Car ownership is typically much lower, especially in city-centre and campus-adjacent locations. Walking, cycling, bus and rail use are usually much higher. And the daily rhythm of movement is shaped by timetables, seminar slots, library hours, nightlife and term dates rather than the standard nine-to-five commuter profile.

    That changes both the data inputs and the narrative. Highway peaks may still matter, particularly for servicing and background traffic, but lecture start times can create their own directional surges on footways, crossings and cycle routes. Weekend activity can also be stronger than on conventional residential schemes, especially near retail cores and stations.

    Then there are the exceptional days. Move-in and move-out periods create short, intense waves of activity that bear little resemblance to normal occupation. One badly planned September weekend can generate more local complaint than months of ordinary operation.

    So we need to separate everyday demand from event-style demand. We also need to test whether the low-car proposition is genuinely secured by location, tenancy terms, parking controls and university culture, not just assumed. That distinction is central to a robust Residential Development Transport comparison and, more importantly, to a report that local authorities will trust.

    Core Policy And Planning Considerations For PBSA Schemes

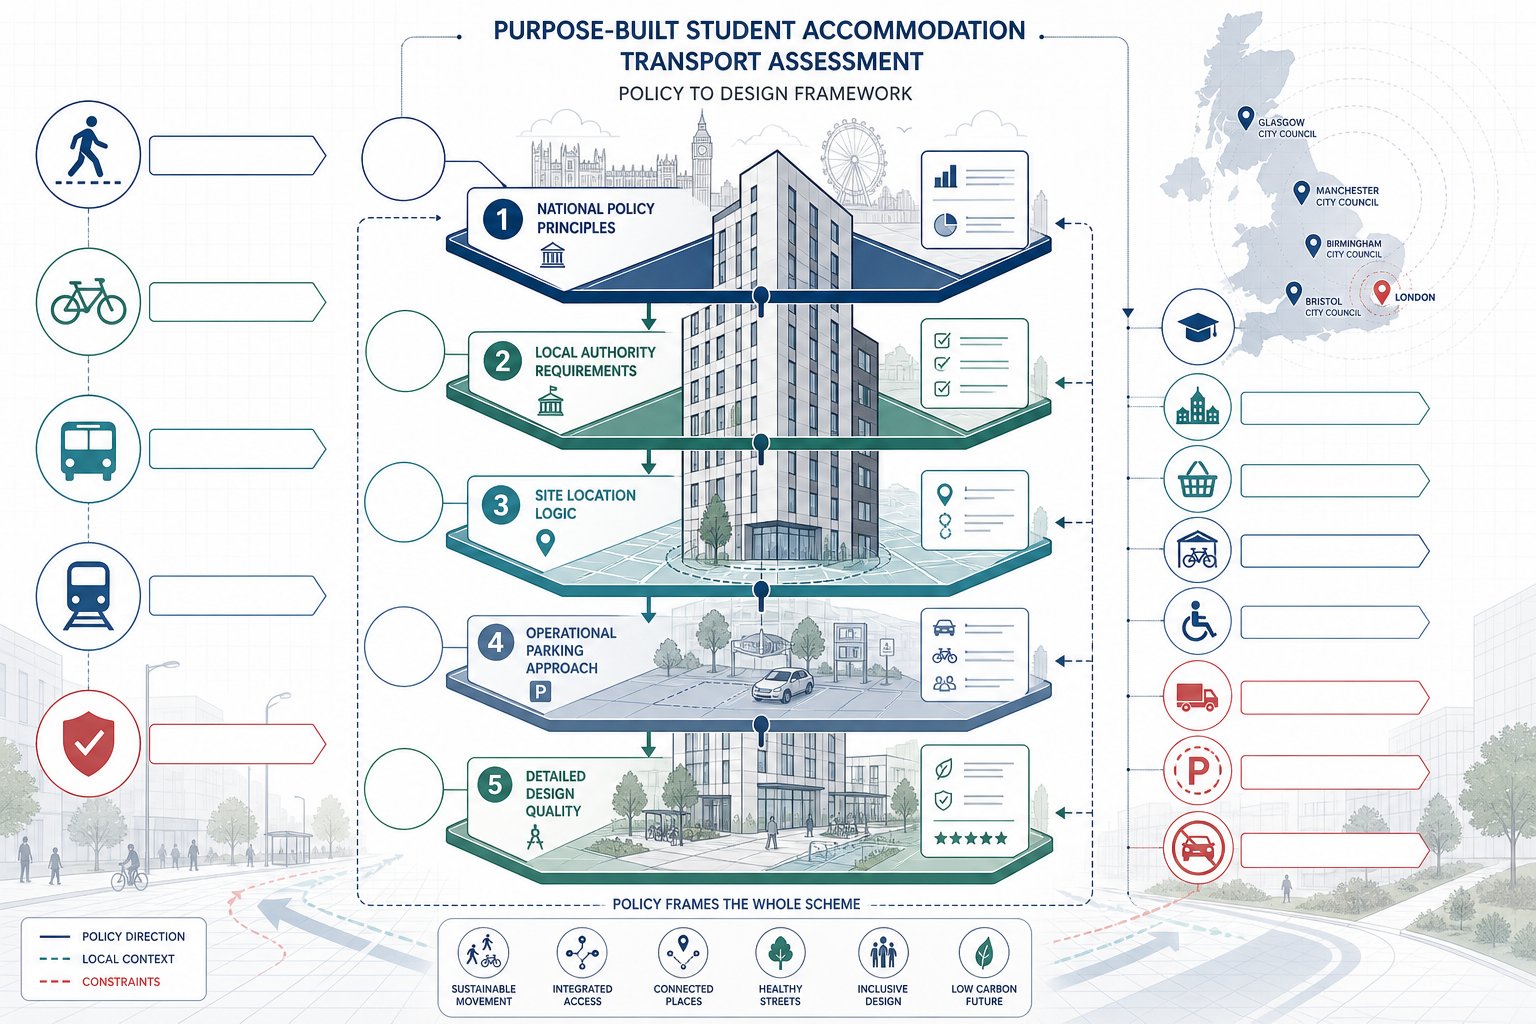
    UK PBSA planning infographic showing policy, access, parking, and design factors.

    In 2026, policy compliance is not a box-ticking exercise for PBSA transport work. It is often the frame through which the whole scheme is judged.

    Nationally, the key themes remain familiar: sustainable transport, safe and suitable access, opportunities to promote walking, cycling and public transport, and proportionate mitigation where impacts are material. But local policy is usually where PBSA applications become more exacting. Many authorities now have clear expectations on location relative to campus, town centre accessibility, cycle parking standards, disabled access, servicing, and car-free or car-lite operation.

    London boroughs are an obvious example, but similar patterns now appear well beyond the capital. Some councils expect student accommodation to demonstrate a sequential logic: near campus, near high-frequency public transport, and within easy walking distance of everyday needs. Others place heavy weight on controlled parking zones, street capacity, and whether lease clauses can support a no-car model.

    Design guidance matters too. Cycle stores that technically meet numbers but are awkward to use will attract criticism. Blue Badge provision that is remote from entrances or poorly designed can undermine an otherwise strong transport case.

    From a planning strategy perspective, we usually advise teams to map the national policy tests first, then build in local plan, SPD, design code and parking-standard requirements around them. On more complex schemes, that thinking can sit alongside a mixed use masterplan movement strategy so access and placemaking are aligned from the outset.

    Trip Generation And Mode Share Assumptions For Student Accommodation

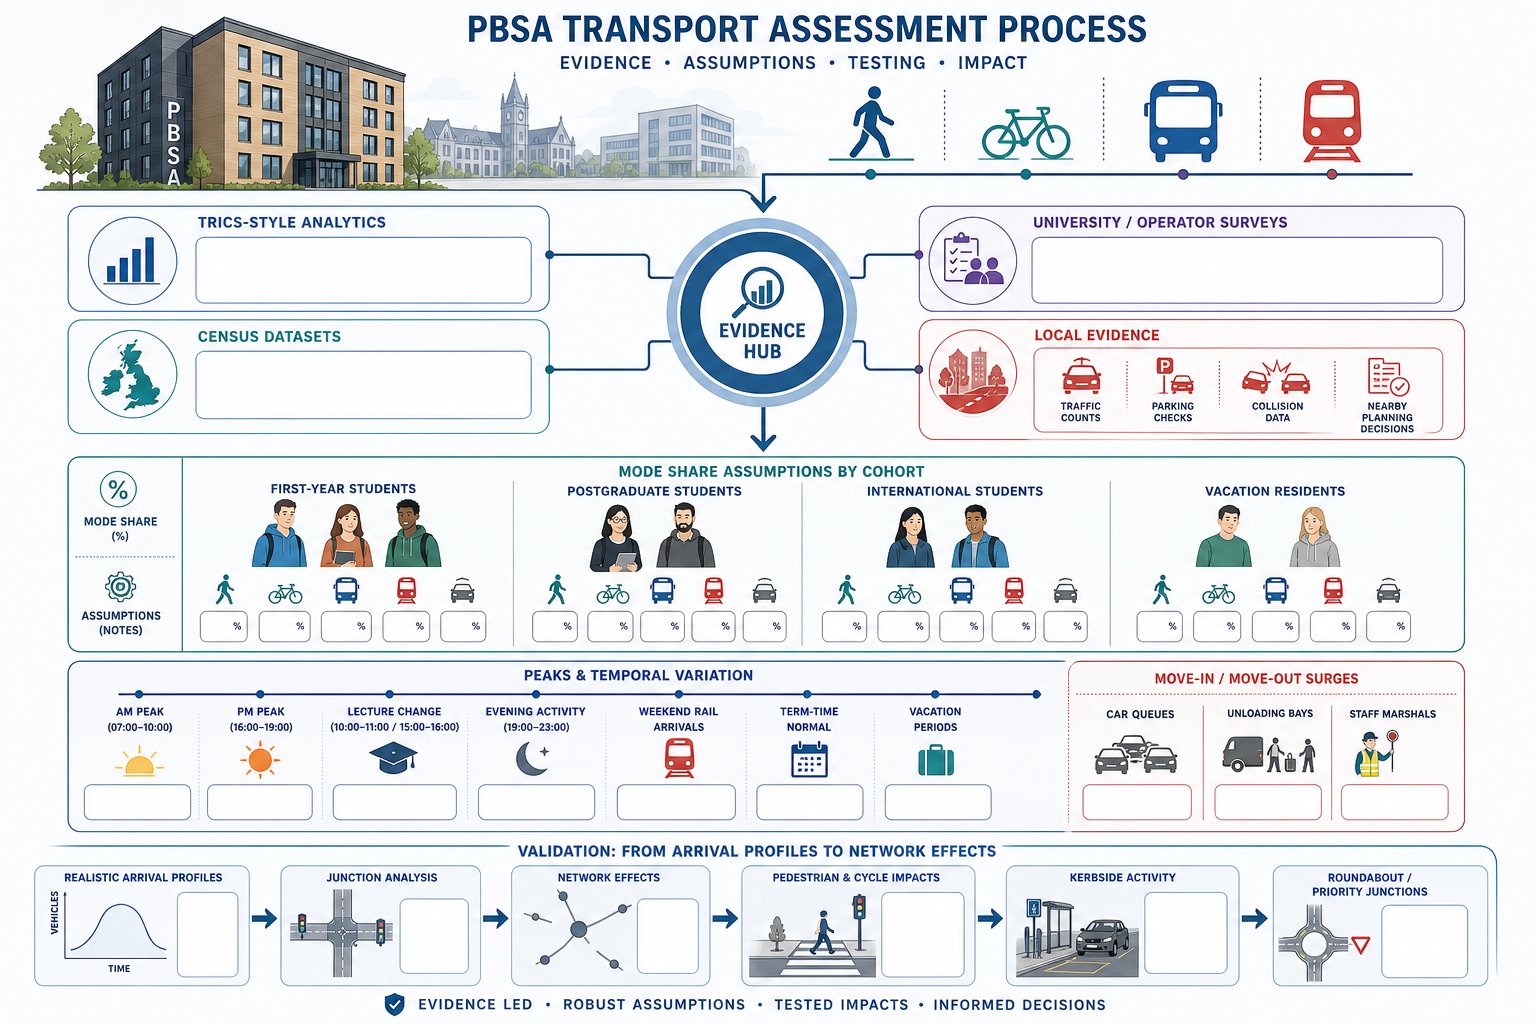
    Infographic of PBSA student travel assumptions, evidence sources, and peak period patterns.

    Trip generation is often the most scrutinised part of a PBSA assessment because weak assumptions ripple through almost everything else: junction impact, servicing conflict, parking risk and travel plan credibility.

    For student accommodation, we should usually focus on person trips first and vehicle trips second. That sounds obvious, but many poor reports still foreground cars in a way that distorts how the building will actually operate. The task is to estimate how students travel during term time, outside term, at weekends and during move-in or move-out periods, and then translate that into realistic network effects.

    Mode share assumptions need to reflect the specific offer. A scheme one short walk from campus with strong bus and rail links, secure cycle parking and no general parking will perform very differently from a peripheral site with patchy evening bus service. The assumptions should also recognise different cohorts: first-year undergraduates, postgraduates, international students, and residents staying through vacation periods may all travel differently.

    This is also where local authority trust is earned. If the report simply states “students don’t drive”, officers will probe. If it evidences low car ownership, validates likely travel choices and explains the controls that support them, the assessment becomes much more defensible.

    Using Census, TRICS, Surveys, And Local Evidence

    No single data source is enough on its own. The strongest PBSA assessments triangulate.

    TRICS remains useful for comparable student halls and PBSA sites, particularly for person-trip rates and observed mode splits. But raw outputs need careful filtering by location type, accessibility and scale. A suburban comparator can mislead badly if the application site is central and campus-linked.

    Census data can then provide a broader sense-check on student travel behaviour and local car ownership patterns, especially where there is clear evidence about journeys to higher education or relevant demographic proxies. University or operator surveys are often the missing piece. They can reveal timetable-led peaks, cycle demand, rail use by international students, and the real rate of car arrivals during term starts.

    Local evidence matters just as much: traffic counts, parking beat surveys, collision records, bus service data and existing planning decisions nearby. In practice, we often combine these strands in the same way a wider Purpose-built Student Accommodation Transport Assessment is built, not by relying on one dataset, but by creating a coherent evidence story that officers can audit.

    Peak Periods, Term-Time Variation, And Arrival Patterns

    The phrase “peak hour” can be a trap in PBSA work.

    Yes, we still need to test the network in recognised AM and PM highway peaks where required by the authority. But student activity often peaks around lecture starts, lunchtime class changes, evening leisure periods and rail arrivals at weekends. A highway model that only looks at a standard commuter peak may miss the practical stress points on footways, crossings, cycle access and kerbside activity.

    Term-time variation is also important. Early autumn can be intense: exam periods may produce different campus movement patterns: and vacation periods can reduce occupancy but increase irregular servicing or visitor activity. Move-in and move-out need their own assumptions entirely: arrival rates per hour, car occupancy, unloading dwell times, staff presence and holding arrangements.
    If junction assessment is required, the software choice and modelling assumptions should be transparent. For priority and roundabout access, tools such as Junctions 11 Software may support the evidence base, but the numbers are only as credible as the arrival profile sitting behind them.

    Site Access, Highway Impact, And Servicing Requirements

    PBSA access design needs to work for three overlapping systems at once: everyday student movement, operational servicing, and occasional high-intensity arrivals.

    Pedestrian access usually comes first. Desire lines to campus, town centre, bus stops and rail stations should be direct, legible and safe, with crossing provision considered where natural routes meet traffic. Cycle access should avoid awkward dismount points and pinch points at entrances. If the access strategy asks students to use a route they plainly won’t choose, the report should expect challenge.

    Vehicular access may be minimal in car-free schemes, but it still matters for refuse, maintenance, removals, Blue Badge users and emergency arrangements. Visibility, swept path design, gate positions, servicing headroom and interaction with buses or existing cycle lanes all need to be resolved. On constrained urban sites, the friction between delivery vehicles and active travel routes is often the real issue, not junction capacity in isolation.

    Where traffic effects could be material, junction modelling may be needed using tools such as PICADY, ARCADY or LINSIG, depending on context. But for many PBSA schemes, a clear qualitative explanation of limited vehicle generation, coupled with robust servicing management and move-in controls, is just as influential.

    And if servicing is hand-waved away as “standard van activity”, expect objections. Officers want to know who arrives, when, where they stop, how long they stay, and how conflicts are prevented.

    Walking, Cycling, Public Transport, And Campus Connectivity

    For PBSA, sustainable travel isn’t an add-on chapter. It is the core planning argument.

    We need to show not just that the site is near a campus or bus stop, but that the routes are genuinely usable. A ten-minute walk on paper can be a poor route in reality if it involves severance, poor lighting, hostile crossings or steep gradients. The same goes for cycling: a route may technically exist, but if it disappears into a multi-lane gyratory or lacks secure destination parking, students may default to buses or ride-share instead.

    Public transport analysis should cover frequency, span of service, reliability where possible, interchange quality and journey times to campus and the wider city. In larger university cities, rail can also be important for weekend travel and international arrivals. Where a local metric such as PTAL or equivalent accessibility mapping is used, it should support, not replace, a real-world assessment of routes.

    Good reports tie the scheme into broader travel behaviour too: university travel plans, local active-travel corridors, nearby cycle hire, and future highway or streetscape improvements. That shows the proposal is part of a movement network rather than a standalone building.

    For applicants, this is often the section that helps a scheme feel planning-ready. It also reflects the sort of concise, authority-focused reporting we value in a Purpose-built Student Accommodation Transport Assessment prepared to local context rather than generic national wording.

    Car Parking, Blue Badge Provision, And Car-Free Development Issues

    Most PBSA schemes now propose very limited general parking, and many are effectively car-free. That can be entirely appropriate, but only if the strategy is credible and enforceable.

    The first test is locational. A low-parking proposal is much easier to defend where the site is close to campus, shops and frequent public transport. The second is operational. Councils will want to know how residents are prevented from bringing cars, whether tenancy agreements restrict permits, how any controlled parking zone operates, and what happens if overspill starts appearing on nearby streets.

    Then there is accessibility. Even the most car-lite scheme still needs to deal properly with Blue Badge parking, set-down and step-free access. Provision should be close to entrances, well-signed, safe and available when needed. Treating disabled access as an afterthought is one of the quickest ways to weaken the application.

    Cycle parking often sits in the same policy conversation. Quantity matters, but quality matters more than applicants sometimes think: security, weather protection, ease of use, natural surveillance and space for adapted cycles can all become planning issues.

    In short, a car-free claim is not a slogan. It is a package of location, design, management and enforcement. If any one of those is missing, neighbours and officers will notice.

    Student Move-In, Move-Out, And Servicing Management Plans

    If there is one section that separates a merely adequate PBSA transport report from a genuinely planning-savvy one, it is this.

    Move-in and move-out periods create concentrated demand in a way normal residential occupation rarely does. Families arrive with loaded cars and vans, students need time to unload, and everyone wants to stop as close to the entrance as possible. Without a management plan, nearby streets can gridlock very quickly.

    A proper strategy should set out staggered arrival booking slots, likely arrival profiles by hour, expected vehicle occupancy, unloading dwell times, marshal roles, signage, temporary traffic management where needed, and contingency arrangements if cars arrive early or queue. Some sites benefit from off-site holding areas or one-way internal circulation. Others need strict kerbside controls and coordination with neighbouring uses.

    Communication is part of the transport solution too. Residents, parents, universities, neighbours, the highway authority and servicing operators should all know how the system works before term starts.

    Servicing then needs its own ongoing plan: refuse collection points, parcel delivery arrangements, maintenance access, loading restrictions and preferred time windows. On urban sites, parcel volumes alone can become significant.

    This is also where experienced input helps. Teams often benefit from working with Transport Assessment Consultants: who can translate a broad management idea into something officers can condition, monitor and rely on.

    Common Risks In PBSA Transport Assessments And How To Avoid Them

    The most common problems are surprisingly consistent.

    First, underestimating trip generation or relying on generic residential assumptions. Student accommodation may generate fewer car trips, but it can produce intense person-trip movement and very sharp operational peaks. The fix is straightforward: use PBSA-specific comparators, local surveys and a clear explanation of why the assumptions fit the site.

    Second, treating low car ownership as self-evident. It usually isn’t. Authorities want evidence of local student behaviour and practical controls such as lease restrictions, parking management and strong campus connectivity.

    Third, ignoring walking and cycling quality. A report that lists distances but says little about route comfort, crossings, gradients or conflict points will feel thin. Students choose routes based on convenience and safety, not just mapping software.

    Fourth, leaving move-in and servicing too late. By the time objections are raised, retrofitting a management strategy can look reactive. It is far better to address those issues at application stage.

    And finally, weak scoping. Early engagement with the highway authority, university stakeholders and the design team saves a great deal of friction later. Where technical evidence needs to be produced quickly, a focused Purpose-built Student Accommodation Transport Assessment approach, tailored to local thresholds and planning expectations, tends to produce stronger, faster outcomes than a generic template report.

    Conclusion

    A strong PBSA transport assessment is evidence-led, student-specific and grounded in how the building will actually operate, not how we wish it would operate. The recurring themes are clear: realistic mode share assumptions, careful treatment of term-time and move-in peaks, safe and direct active-travel access, workable servicing, and a parking strategy that can be enforced in practice.

    For planning teams, the key in 2026 is to avoid generic residential thinking. Student accommodation has its own movement profile, its own policy sensitivities and its own operational flashpoints. When those are addressed early, and backed by local data, clear management plans and proportionate mitigation, the transport case becomes far more resilient.

    That is eventually what decision-makers are looking for: confidence that the scheme supports sustainable travel, protects the surrounding network, and can function smoothly from opening day onwards.

    Frequently Asked Questions About Purpose-Built Student Accommodation Transport Assessment

    What is a Purpose-Built Student Accommodation Transport Assessment?

    It is a detailed report supporting planning applications that demonstrates how student travel demand, access, parking and servicing will be safely and sustainably managed for a student housing development.

    When is a transport assessment required for student accommodation developments?

    Typically, major schemes exceeding 50 to 80 bedspaces or projects likely to impact local junctions, parking, or bus corridors require a transport assessment, as do those triggered by specific local planning or transport policies.

    How does travel demand for Purpose-Built Student Accommodation differ from regular residential developments?

    Student housing usually involves very low car ownership, with high walking, cycling and public transport use. Travel peaks align with lecture times and term dates rather than typical commuter hours, requiring distinct trip generation and mode share assumptions.

    What key elements should a PBSA transport assessment cover?

    It should address development size, student profiles, trip generation, mode share by time period, access strategies, parking, servicing, move-in/out management, and alignment with local and national transport policies.

    How can move-in and move-out periods be managed to avoid local disruption?

    By implementing staggered arrival slots, on-site marshals, clear signage, temporary traffic measures, and communication with stakeholders, which are all detailed in robust management plans within the assessment.

    Why is it important to consider walking, cycling, and public transport connectivity in a PBSA transport assessment?

    Because sustainable travel options form the core planning argument, ensuring safe, direct, and convenient routes to campus and town centres supports car-free strategies and overall scheme acceptance by authorities.

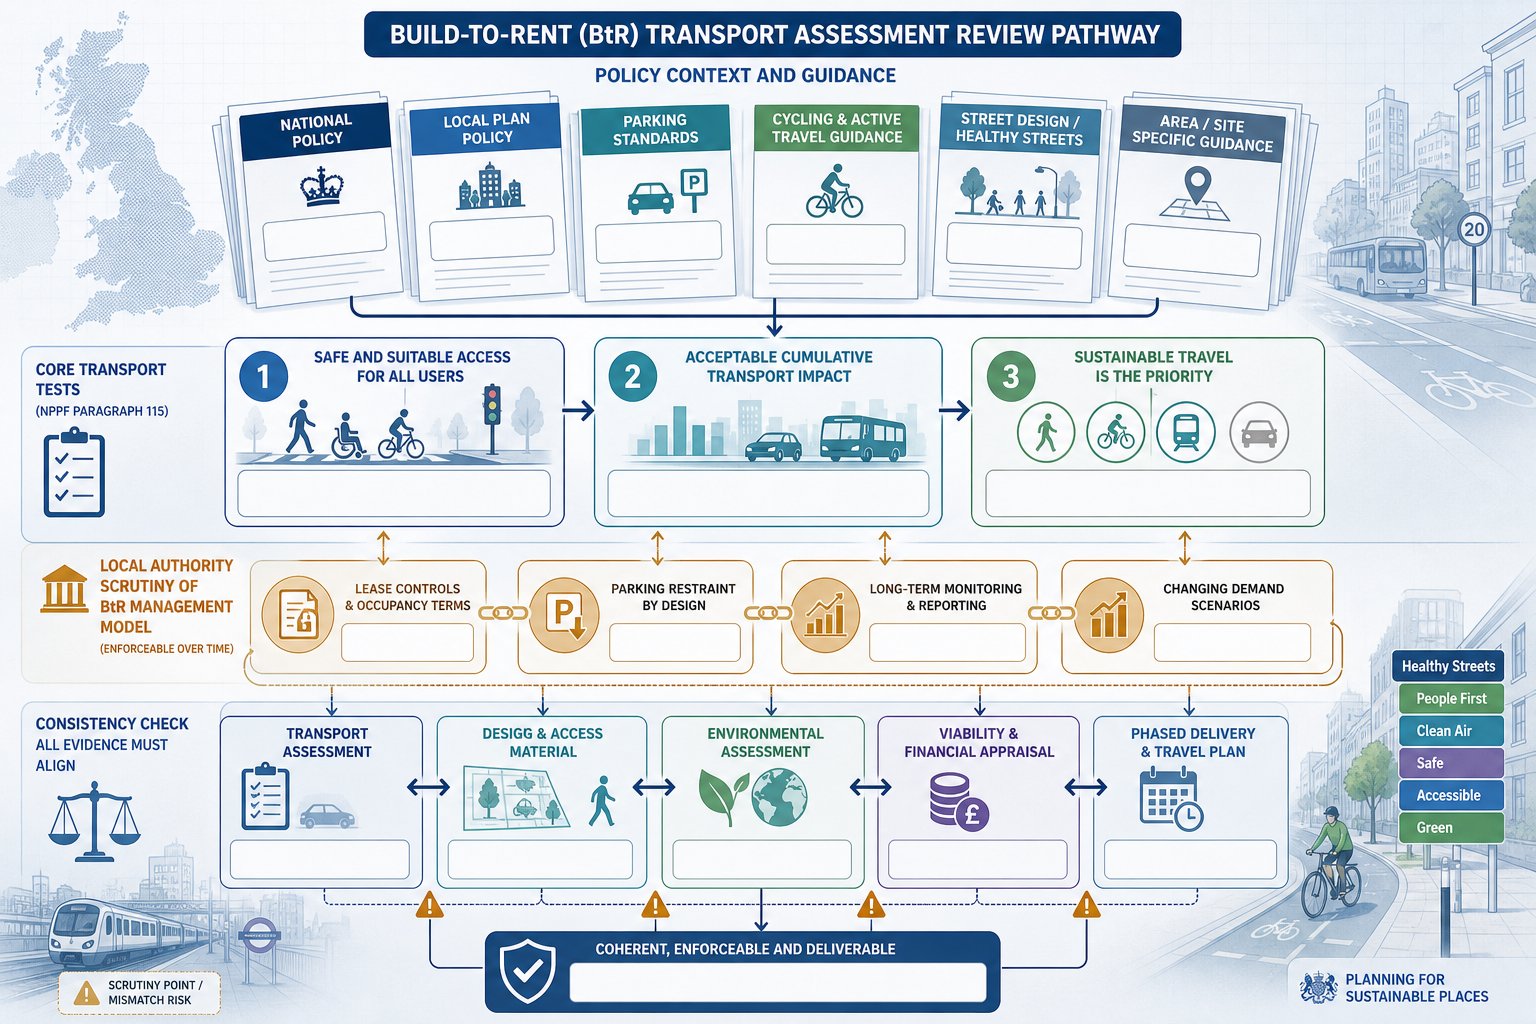
  • Build-To-Rent Residential Schemes Transport Assessment: What Planning Teams Need To Get Right In 2026

    Build-To-Rent Residential Schemes Transport Assessment: What Planning Teams Need To Get Right In 2026

    Build-to-rent has matured fast in the UK. What was once treated as a niche residential product is now a mainstream delivery model in city centres, regeneration areas, and increasingly in suburban growth locations too. But planning teams still run into the same problem: transport evidence is often prepared as if BtR were just another C3 housing scheme with a different brochure.

    That usually doesn’t hold up for long. Local planning authorities and highway officers are asking sharper questions about tenure, operational management, parking restraint, delivery demand, and whether the proposed mode share is genuinely realistic for the site. In other words, a Build-to-Rent Residential Schemes Transport Assessment can’t simply recycle assumptions from a for-sale apartment block and expect no challenge.

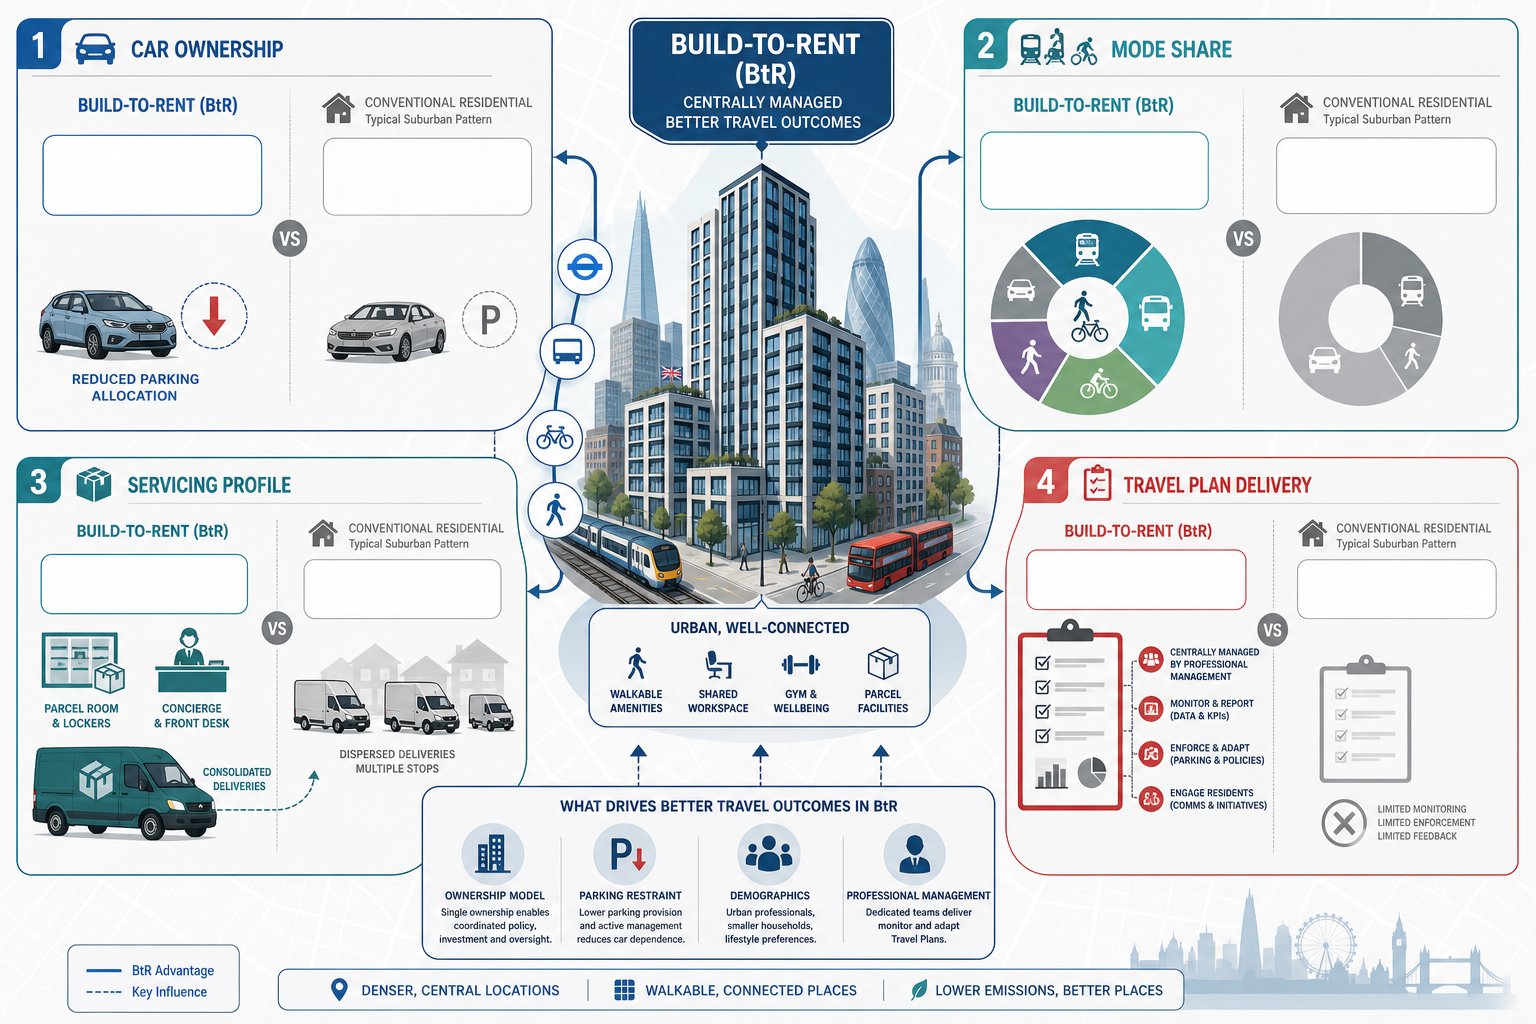
    We’ve found the strongest submissions do two things well. First, they follow standard UK transport assessment methodology properly. Second, they explain, with evidence, how BtR occupancy, management and travel behaviour differ from conventional residential development. That means tighter trip generation logic, clearer servicing strategies, and a much more robust link between what the operator says will happen and what planning controls can actually secure.

    In this guide, we set out what planning teams need to get right in 2026: when a full TA is needed, what local authorities expect, where trip rate arguments often fall apart, and how to present a BtR transport case that is credible from first review rather than after three rounds of technical queries.

    Key Takeaways

    • Build-to-Rent (BtR) transport assessments must follow UK TA standards but explicitly address BtR operational differences to be credible.
    • Effective BtR transport assessments account for lower car ownership, specific mode share, managed servicing, and enforceable travel plans linked to management.
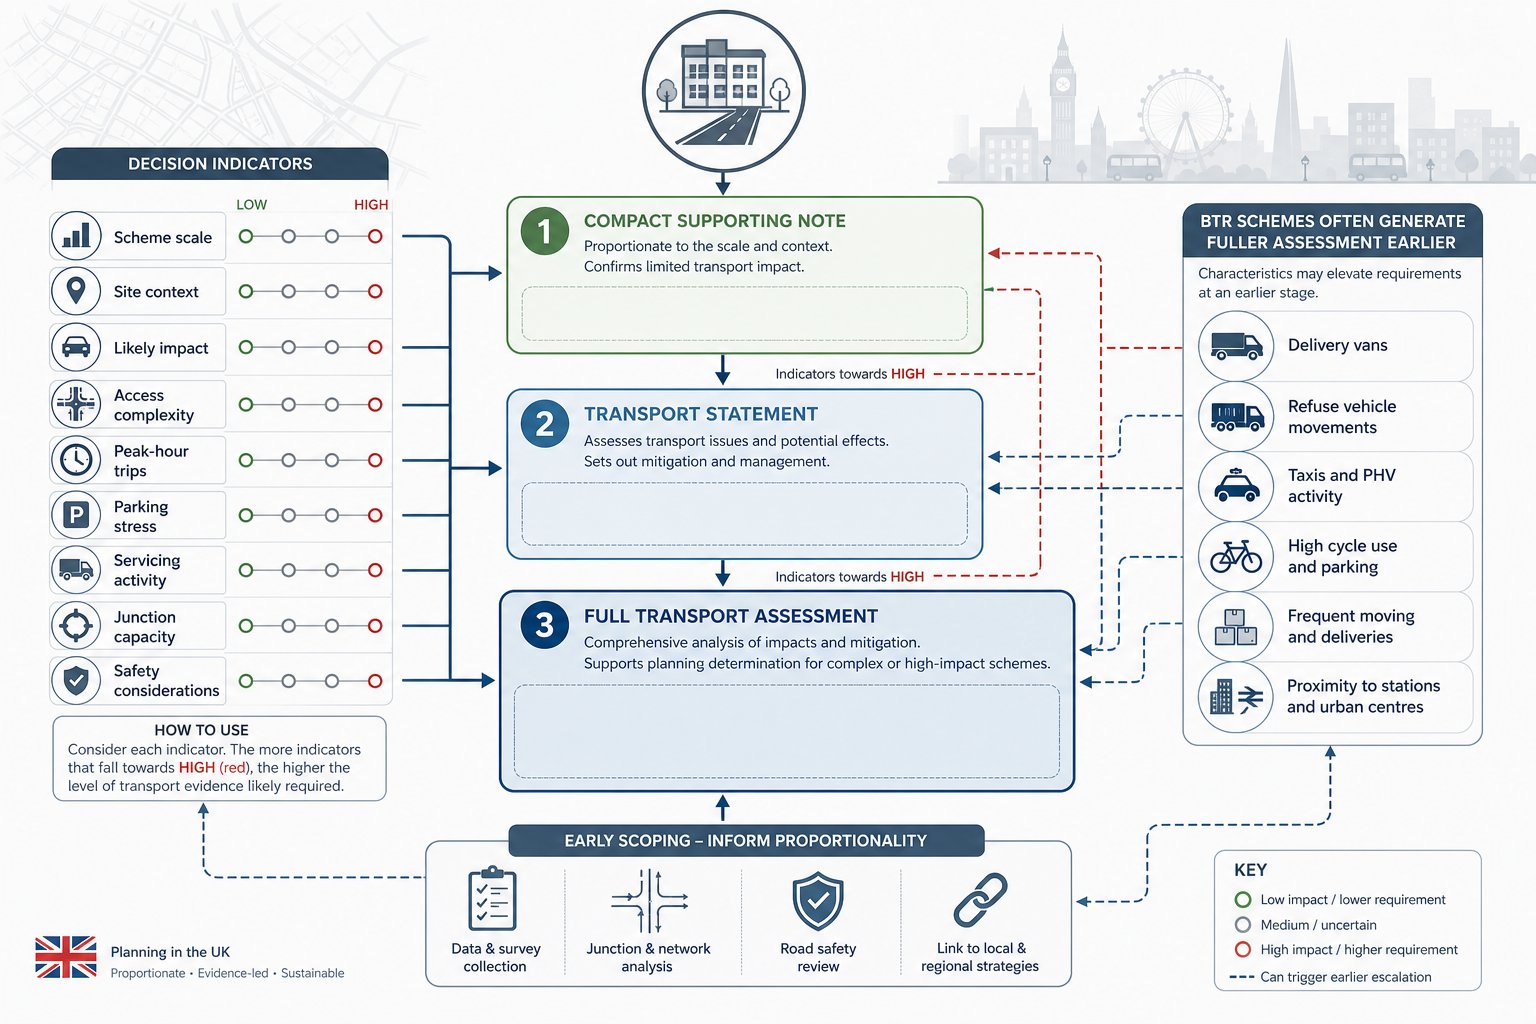
    • A full Transport Assessment is often required for BtR schemes earlier than expected due to servicing, refuse, delivery demand, and access complexity.
    • Robust trip generation for BtR relies on layered evidence including TRICS data, comparable schemes, local surveys, and management impacts rather than generic residential rates.
    • Access design, junction capacity, and pedestrian safety are critical to prevent objections despite low vehicle trip generation in BtR developments.
    • Parking strategies should balance local standards with BtR management controls, covering Blue Badge, cycle parking, and micro-mobility to ensure practical sustainable transport.
    • Strong Travel Plans utilising BtR operator control provide enforceable sustainable travel measures, supported by clear mitigation and appropriate planning conditions or S106 obligations.
    • Common failures include unsupported mode share or car ownership claims, weak servicing evidence, inconsistent documents, and lack of enforceable management strategies, which should be avoided for smoother planning approval.

    What A Transport Assessment For Build-To-Rent Schemes Needs To Cover

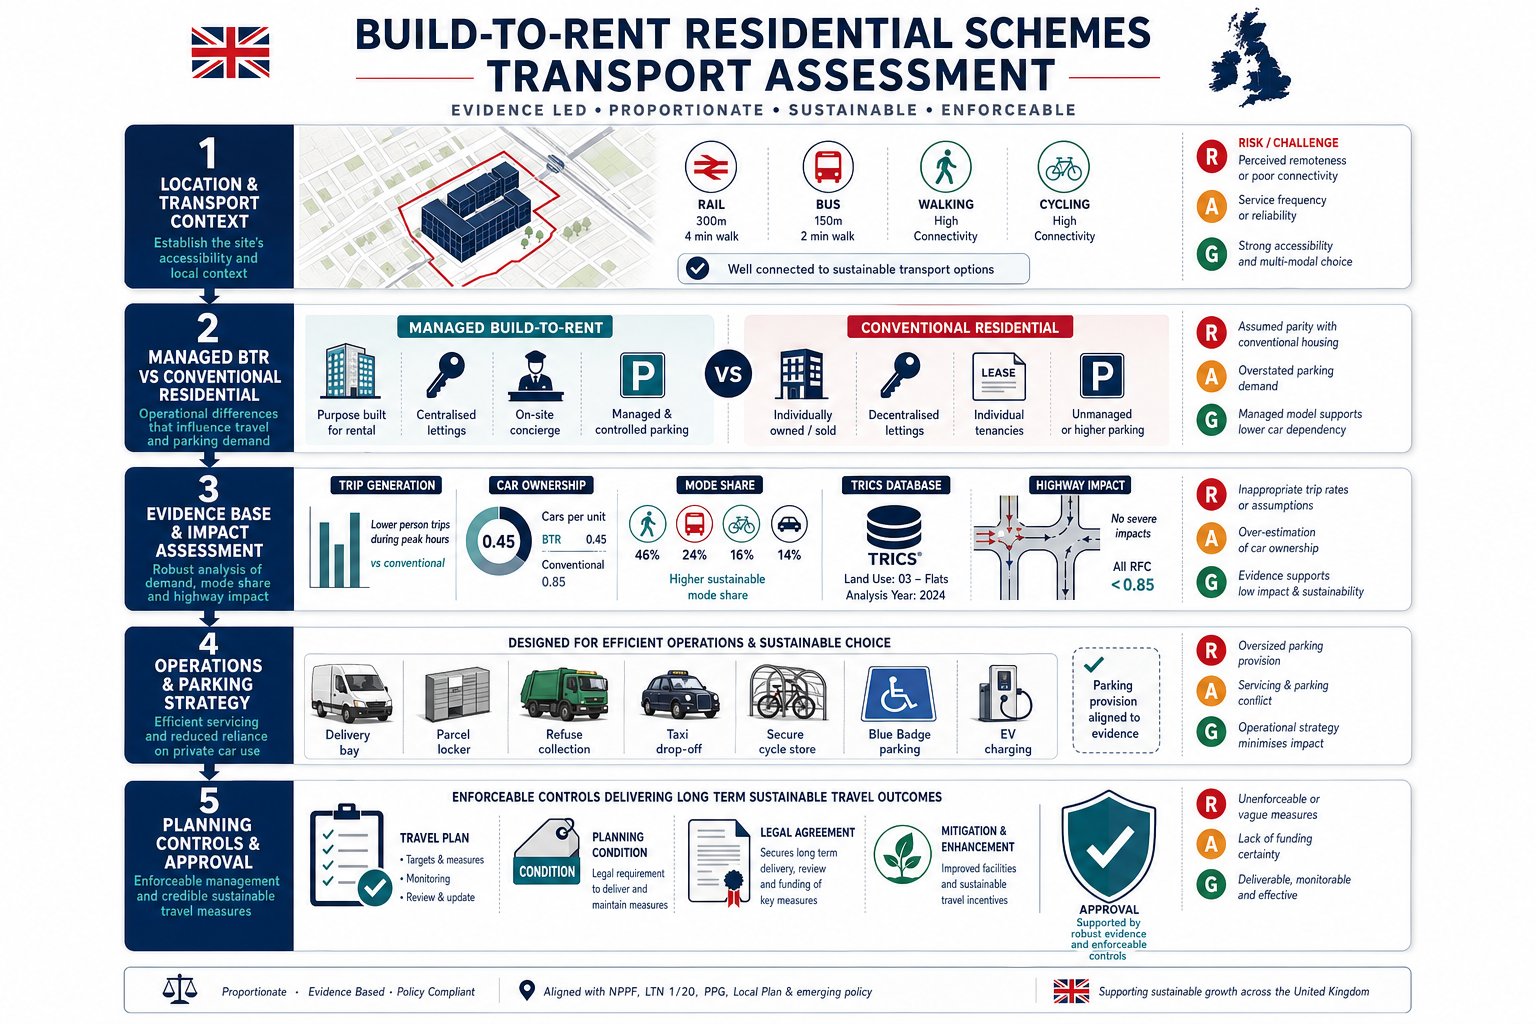
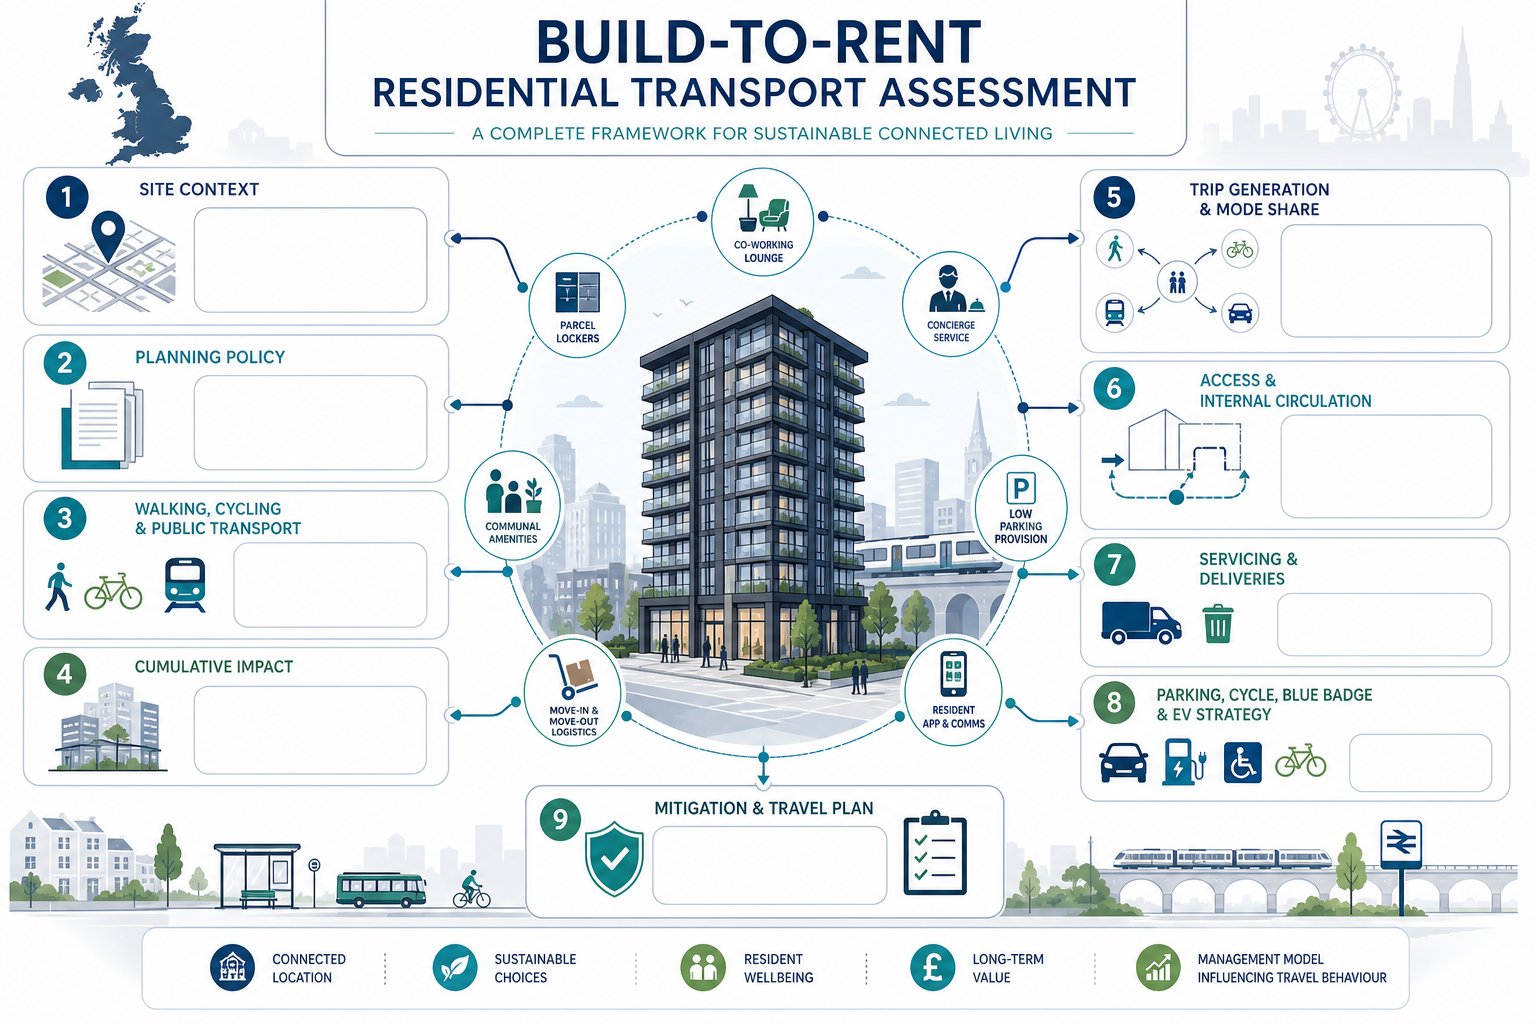
    Infographic of Build-to-Rent transport assessment components for a UK residential scheme.

    A transport assessment for a BtR scheme should still follow established UK TA structure, but the content needs to be explicitly tailored to the way the development will operate. That starts with a clear description of the proposal: unit numbers, mix, tenure model, affordable provision where relevant, communal areas, on-site staff, concierge arrangements, move-in management and resident amenities.

    Those details aren’t background colour. They shape travel behaviour. A scheme with co-working lounges, parcel storage, managed refuse, low parking provision and strong rail access may perform very differently from a conventional private sale block in the same borough.

    A sound assessment should cover:

    • site location and surrounding transport context
    • relevant planning policy and local standards
    • existing highway, walking, cycling and public transport conditions
    • committed development and cumulative impact where required
    • trip generation, mode share and car ownership assumptions
    • access arrangements and internal circulation
    • servicing, refuse collection and delivery demand
    • parking, cycle storage, Blue Badge spaces and EV strategy
    • mitigation, Travel Plan and any likely condition or S106 triggers

    For planning teams already preparing wider residential evidence, a BtR submission usually sits best within a broader transport assessment for the whole scheme rather than as an isolated appendix. But the tenure-specific narrative must be visible. If it’s buried, reviewers often assume it hasn’t really been tested.

    How Build-To-Rent Differs From Conventional Residential Development

    Build-to-rent transport infographic comparing car use, travel modes, servicing and management.

    BtR differs from conventional residential in ways that matter directly to transport planning. The biggest distinction is operational: single ownership, professional management and long-term rental. That changes how parking is allocated, how leases are enforced, how servicing is organised and, sometimes, who chooses to live there.

    In practice, many BtR schemes are denser, more centrally located and more deliberately linked to public transport, employment centres and walkable services. Resident amenities can suppress some off-site trips while increasing others at different times of day. A gym, parcel room or shared workspace may reduce outbound movements in one peak but create different internal activity patterns.

    That doesn’t mean every BtR scheme automatically generates fewer vehicle trips than a conventional C3 development. That’s where some applications overreach. The argument only works when location, parking restraint, demographics and management arrangements all point in the same direction.

    We normally expect key differences to influence four areas:

    1. Car ownership – often lower where leases restrict parking and alternatives are strong.
    2. Mode share – rail, bus, walking and cycling may capture a higher proportion of trips.
    3. Servicing profile – managed deliveries and concierge functions can change daily activity.
    4. Travel Plan delivery – operator control makes monitoring and behavioural measures more enforceable.

    A useful benchmark is to compare the scheme against a wider Residential Development Transport evidence base, then explain precisely why the BtR product should depart from conventional assumptions.

    When A Full Transport Assessment, Transport Statement, Or Supporting Note Is Needed

    Decision infographic showing when transport evidence is needed for UK build-to-rent schemes.

    This is still driven by scale, context and likely impact rather than by tenure alone. National policy and Planning Practice Guidance set the broad framework, but each local highway authority will have its own thresholds and expectations. Some rely mainly on unit numbers: others look more closely at peak-hour trips, access complexity, parking stress or whether the site sits on a constrained urban network.

    As a rule of thumb:

    • Supporting Note: suitable for small schemes with negligible transport effects, straightforward access and no meaningful highway or servicing concerns.
    • Transport Statement: suitable for medium-sized proposals where impacts are limited but still need structured evidence on access, parking, sustainable travel and trip generation.
    • Full Transport Assessment: needed for larger schemes, high-density urban blocks, sensitive sites, proposals with servicing complexity, or any development likely to affect junction capacity, safety or local parking conditions.

    For BtR, the case for a fuller assessment often arises earlier than applicants expect. Why? Because even if private car trip generation is low, highway officers may still want proper evidence on deliveries, refuse, taxis, drop-off activity, cycle numbers, move-in operations and cumulative impacts near stations or busy mixed-use corridors.

    Where modelling is likely, the scope should be agreed early. That can include surveys, junction assessment, road safety review and links to a wider Development Transport Assessment: A planning strategy so the transport workstream isn’t left trying to catch up after layout has been fixed.

    Key Planning Policy And Local Authority Expectations

    UK planning infographic showing Build-to-Rent transport assessment policy and review checks.

    In 2026, highway authorities are still testing BtR proposals against the same core transport questions: is there safe and suitable access for all users, can the residual cumulative impacts be shown to be acceptable, and does the scheme genuinely prioritise sustainable travel rather than just describing it nicely?

    The policy stack usually includes the National Planning Policy Framework, Planning Practice Guidance, the local plan, parking standards, cycling standards, street design guidance and any relevant area-specific SPD. In London and some larger cities, applicants may also need to respond to more developed policy on car-free housing, healthy streets, urban logistics and accessibility metrics.

    For BtR specifically, local authorities tend to focus on whether the management model is real, durable and enforceable. A statement that parking demand will stay low because residents will be “encouraged” not to own cars usually isn’t enough. Officers want to know what is secured through lease terms, what is physically constrained by design, and what happens if demand shifts over time.

    We also see more scrutiny where transport reasoning interacts with viability or wider environmental effects. On larger mixed-use or phased schemes, transport evidence may need to align with environmental impact assessment work and with the applicant’s broader programme for delivery. Consistency matters. If the TA says one thing about parking restraint and the Design and Access Statement implies another, the technical case starts to wobble very quickly.

    Core Trip Generation And Mode Share Evidence For Build-To-Rent

    Infographic of layered Build-to-Rent trip evidence and car ownership strategy.

    Trip generation is where many BtR transport assessments are won or lost. Generic residential rates can be a starting point, but they are rarely the whole answer. The aim is to build a proportionate evidence base that reflects site context, public transport accessibility, parking provision, resident profile, unit mix and operational management.

    The best approach is layered rather than single-source. We typically combine TRICS, comparable development evidence, Census or journey-to-work data where still useful, local travel surveys, and a clear explanation of how the scheme’s management model affects outcomes. That way, even if one evidence strand is imperfect, the overall conclusion remains robust.

    Crucially, mode share assumptions should be internally consistent. A scheme cannot sensibly claim very low car ownership, very low parking provision and also a weak walking/cycling/public transport offer unless there is compelling local evidence. Likewise, on-site amenities may reduce some external trips, but that needs to be reasoned carefully rather than treated as a blanket reduction factor.

    Using Comparable Sites And TRICS Data Effectively

    TRICS remains an important tool, but BtR analysis lives or dies on filtering and interpretation. The temptation is to pull generic flats data, remove obvious outliers, and present reduced peak-hour trip rates. Highway officers spot that pattern immediately.

    A better method is to select sites that are genuinely comparable in:

    • urban or suburban context
    • rail and bus accessibility
    • parking restraint
    • block form and density
    • unit profile
    • tenure and managed operation, where known

    Where specific BtR survey data is available from operators or comparable consented schemes, it can materially strengthen the case. But comparables need to be explained, not just listed. Why this scheme? Why this catchment? Why this parking level? Those questions should be answered in the text.

    On more complex applications, supporting trip evidence may sit alongside a residential traffic impact review so that rate selection and network effects are tied together rather than treated as separate exercises.

    Accounting For Car Ownership, Tenure, And Managed Operations

    Car ownership is often the hinge point for the whole BtR transport strategy. If projected ownership is too low, parking stress objections appear. If it is too high, the sustainable transport story falls apart. So the evidence needs to be careful, local and realistic.

    We generally test car ownership against comparable BtR schemes, local Census car availability, parking permit controls, PT accessibility, unit mix and lease arrangements. Managed operations matter a lot here. A professionally run scheme can control parking allocation, run waitlists, restrict second-car parking, support car clubs and manage resident communications in ways a conventional private sale block often cannot.

    That said, management claims need planning hooks. If a concierge-led parcel strategy or car-free tenancy approach forms part of the transport case, it should be capable of being secured through condition, legal agreement or an approved management plan.

    It also helps to consider operational details that change travel patterns at the margins but meaningfully so over a year: move-in bookings, visitor management, parcel consolidation, co-working space use, and the availability of cargo bikes or shared e-bikes. Small levers, used together, often make the strongest evidence.

    Access, Highway Impact, And Junction Capacity Considerations

    Even on low-car schemes, access design still matters. A BtR development needs to show that resident vehicles, servicing, refuse, emergency access, taxis, cycles and pedestrians can all operate safely without awkward conflict points or unrealistic manoeuvres.

    Most highway officers will expect a clear access strategy covering visibility, swept paths, gradients, pedestrian priority, cycle crossing movements and any kerbside interaction. On constrained urban sites, that often means spending as much time on the street interface as on the internal layout. A technically compliant access that creates delivery conflict outside the entrance every evening is unlikely to feel acceptable in practice.

    Junction capacity assessment may be required where forecast trips, local sensitivity or committed growth trigger it. For larger schemes, that can include priority junction modelling, signal assessment and review of nearby network nodes rather than just the immediate site access. When modelling is necessary, methodology and scenario assumptions should be agreed early, particularly if using tools such as Junctions 11 Software.

    Road safety should not be bolted on at the end. Collision analysis, desire line review and an understanding of how vulnerable users actually move around the area are essential. Many objections arise not because the vehicle numbers are huge, but because the access design feels hostile or unresolved for people walking and cycling.

    Walking, Cycling, Public Transport, And Sustainable Travel Requirements

    BtR schemes are often promoted on the strength of their sustainable location. That may be true, but the assessment has to demonstrate it properly. We need more than a map with a few circles around stations.

    A robust active travel and public transport chapter should audit:

    • pedestrian routes to shops, schools, open space, bus stops and stations
    • crossing quality, footway width, lighting and personal security issues
    • cycling connectivity, route comfort and network gaps
    • public transport service frequency, journey times and interchange quality
    • accessibility for disabled users and inclusive design barriers

    In London, PTAL may be relevant: elsewhere, isochrones, timetable analysis and walk-time mapping often work better. The real question is whether day-to-day journeys are attractive enough to support the claimed mode split.

    Mitigation might include new crossings, widened footways, dropped kerbs, improved wayfinding, cycle links, stop upgrades, real-time information or contributions to nearby public realm schemes. Where these measures sit within a larger regeneration framework, they should align with an end to end transport strategy rather than appearing as a last-minute shopping list.

    And one practical point: sustainable travel measures are more persuasive when they are tied to management. Welcome packs, cycle maintenance support, public transport discounts, car club credit and resident communications work better in BtR precisely because an operator is there to keep them alive after occupation.

    Servicing, Refuse Collection, And Delivery Demand In Managed Residential Blocks

    Servicing is one of the most under-estimated elements of BtR transport work. A managed residential block may have lower resident car use than conventional housing, but it often generates more structured servicing activity: parcel deliveries, grocery drop-offs, maintenance visits, linen or cleaning services in some models, resident move-ins, and regular refuse operations.

    A credible strategy should explain where vehicles stop, how long they stay, who manages the process, what happens if bays are occupied, and how pedestrian safety is maintained at the entrance. Parcel rooms, concierge desks and timed delivery windows can reduce failed deliveries and kerbside churn, but only if the building is designed and managed to support them.

    Refuse is equally important. The TA should align with the waste strategy on store locations, collection frequencies, bin presentation, drag distances and vehicle access. Swept-path analysis is often essential, especially on tight urban plots or where refuse collection occurs from a shared street.

    We also advise teams to address abnormal but predictable operations: student move-in style peaks are less common in mainstream BtR, yet first occupation periods, tenancy turnovers and bulk furniture deliveries can still create temporary pressure. If the operational plan ignores these realities, reviewers tend to question whether the rest of the transport case has been tested with enough honesty.

    Car Parking, Blue Badge Provision, Cycle Parking, And Micro-Mobility

    Parking strategy for BtR needs balance. Too much parking can undermine sustainable transport policy and scheme viability: too little, without credible evidence and controls, invites objections about overspill and practicality.

    The starting point should always be local standards, then a reasoned response to site context and the BtR operating model. In many urban locations, reduced parking provision is entirely defensible. But the argument should cover permit eligibility, lease restrictions, allocation principles, visitor parking, EV charging, car club provision and local on-street conditions.

    Blue Badge provision deserves particular care. It should respond to Building Regulations, local standards and the actual management of accessible units and visitor demand. Treating it as an afterthought is a common error.

    Cycle parking has become much more exacting too. Authorities increasingly expect convenient, secure, step-free and user-friendly storage, not simply enough Sheffield stands in a basement corner. Resident and visitor cycle parking should reflect current design guidance, likely cycle type and access ease. For BtR, that often means planning for non-standard cycles, cargo bikes, adapted cycles and charging for e-bikes.

    Micro-mobility is moving from nice extra to practical expectation in some locations. If e-bikes or scooters are part of the offer, the scheme should show where they are stored, charged and managed safely. These details often strengthen the wider transport narrative because they show how low-car living will work day to day, not just in theory.

    Travel Plans, Mitigation Measures, And Section 106 Or Condition Triggers

    BtR schemes usually have an advantage here: the operator can carry out and monitor a Residential Travel Plan more consistently than in fragmented private-sale developments. That’s valuable, and planning teams should use it.

    A strong Travel Plan sets out baseline assumptions, targets, measures, management responsibilities, resident engagement, monitoring periods and review triggers. It should explain who funds the measures, who reports to the authority and what happens if targets are missed. Vague commitments to encourage sustainable travel no longer satisfy most officers.

    Typical measures include:

    • personalised resident travel information
    • cycle training and maintenance offers
    • public transport ticket discounts or introductory incentives
    • car club membership or credit
    • monitoring of cycle store occupancy and parking demand
    • delivery management protocols
    • welcome packs and digital travel information through resident apps

    Mitigation can then be split between physical works and operational measures. Physical works may include crossings, footway upgrades, junction changes, stop improvements or cycle links. Operational measures may sit in management plans, tenancy controls or monitored Travel Plan actions.

    On larger or more sensitive applications, some of this will be secured through planning conditions and some through S106 obligations. That package needs to be proportionate and clearly drafted. Where network effects are wider, it may also connect with a broader traffic impact assessment so mitigation is tied to actual forecast impacts rather than generic asks.

    Common Reasons Build-To-Rent Transport Assessments Are Challenged

    Most challenged BtR transport assessments fail for familiar reasons. Not because BtR is inherently difficult, but because the evidence doesn’t match the claims.

    The most common issues we see are:

    • Generic trip rates used without explaining why conventional C3 flats are comparable.
    • Over-optimistic mode share assumptions unsupported by local walking, cycling or public transport conditions.
    • Weak car ownership evidence, especially where on-street parking pressure already exists.
    • Management claims without planning control, such as saying parking will be restricted or deliveries managed without showing how.
    • Underplayed servicing demand, particularly parcels, taxis and turnover activity.
    • Insufficient junction or safety analysis where local constraints are obvious.
    • Non-compliance with local standards for parking, cycle provision or accessibility.
    • Poor consistency between TA, site layout, servicing drawings, Travel Plan and Design and Access Statement.

    A good rule is this: if a reduced-impact argument depends on BtR management, the assessment should prove that management is credible, resourced and enforceable. If a low-car strategy depends on excellent alternatives, the site audit should show those alternatives genuinely exist. And if the development team wants a quicker planning path, transport work needs to start early, not after the architecture is effectively fixed.

    That’s where concise, locally tuned reporting tends to make the difference. The strongest submissions are rarely the longest: they are the ones that anticipate authority concerns and answer them before the first consultation response lands.

    Build-to-Rent Residential Schemes Transport Assessment FAQs

    What key elements should a Build-to-Rent transport assessment include?

    A Build-to-Rent transport assessment must follow UK TA methodology but tailor content to BtR specifics. It should cover site context, trip generation, mode share, parking, servicing, access, sustainable travel measures, and a robust Travel Plan aligned with operator management and planning policies.

    How does Build-to-Rent differ from conventional residential in transport planning?

    BtR schemes feature single ownership, professional management, and long-term rental, resulting in lower car ownership, stricter parking controls, and different trip patterns. They often have higher density, are near transport hubs, and include amenities that influence travel behaviour differently from conventional C3 developments.

    When is a full Transport Assessment required for a Build-to-Rent development?

    A full Transport Assessment is needed for large, high-density or sensitive BtR sites, or where impacts affect junction capacity or safety. Smaller schemes may require a Transport Statement or Supporting Note. Local thresholds based on unit number and peak trips determine the assessment level, with early scoping advised.

    How should trip rates and mode share be determined for Build-to-Rent transport assessments?

    Trip rates and mode share should be based on layered evidence, including TRICS data filtered for comparable BtR sites, local census or travel-to-work data, and operator surveys. The assessment must justify any reduction from conventional rates by explaining site-specific context, management, and amenities.

    What role does management play in parking and travel behaviour in Build-to-Rent schemes?

    Professional management enables lease enforcement, parking allocation, parking restrictions, and delivery coordination. This control can lower car ownership and trip generation. Transport assessments must show management claims are enforceable through planning conditions or legal agreements to be credible.

    Why is servicing and refuse collection critical in BtR transport assessments?

    BtR schemes usually generate more structured servicing activity including parcel deliveries and refuse. Assessments must detail vehicle access, stopping points, timing, and management to prevent conflicts and ensure safety. Swept-path analysis and alignment with waste strategy are essential for credible delivery demand evidence.

  • Large-Scale Logistics, Warehousing and Fulfilment Centre Transport Assessment: What Planning Teams Need To Get Right In 2026

    Large-Scale Logistics, Warehousing and Fulfilment Centre Transport Assessment: What Planning Teams Need To Get Right In 2026

    Large logistics and fulfilment schemes rarely fail at planning because the warehouse is too small or the cladding colour is wrong. More often, trouble starts on the road network: a queue that backs into a roundabout, an access design that doesn’t work for artics, a shift pattern that was never properly reflected in staff arrivals, or a local authority unconvinced that the site can operate safely at 3am as well as 3pm.

    That is why a Large-Scale Logistics, Warehousing and Fulfilment Centre Transport Assessment needs to be far more than a standard planning appendix. For architects, planners, lawyers, surveyors, developers and councils, it is the evidence base that shows how a scheme will function in the real world, not just on a red-line plan. It has to quantify HGV, van and staff movements, test junction impacts, explain servicing logic, and address the practical questions decision-makers nearly always ask.

    In 2026, that task is getting more exacting. E-commerce demand remains volatile, automation is changing operating profiles, and local planning authorities are increasingly alert to night-time activity, environmental effects and employee accessibility. We’ve seen that the strongest submissions are the ones scoped early, built around the actual operation, and tailored to local thresholds rather than copied from a generic industrial template.

    The sections below break down what planning teams need to get right, where logistics assessments differ from ordinary employment schemes, and the mistakes most likely to slow down consent.

    Key Takeaways

    • A Large-Scale Logistics, Warehousing and Fulfilment Centre Transport Assessment must provide detailed, evidence-led analysis of how the site connects with and impacts the local transport network, beyond a basic planning appendix.
    • Such assessments need to reflect the unique intensity, timing, and physical layout of logistics schemes, including sustained HGV flows, non-traditional peak hours, and precise vehicle manoeuvring requirements.
    • Early scoping with local authorities is essential to define study areas, assessment years, and modelling approaches, ensuring the transport assessment aligns with local thresholds and concerns.
    • Accurate operational data including floorspace, shift patterns, vehicle types, and on-site circulation is critical to generate credible trip profiles and test access and junction capacity effectively.
    • Sustainable travel plans must be realistic and tailored to staff accessibility challenges unique to out-of-centre logistics sites, incorporating feasible measures like shuttle services, cycle infrastructure, and shift coordination.
    • Coordination among planning, architecture, highways, and operations teams from the start avoids inconsistencies, making the transport assessment a proactive tool to design safer, efficient, and easier-to-consent logistics developments.

    What A Transport Assessment Covers For Logistics And Fulfilment Developments

    Infographic of a UK logistics hub transport assessment and surrounding road impacts.

    A transport assessment for a major logistics or fulfilment proposal should explain one simple thing in rigorous detail: how the development will connect to, use and affect the surrounding transport network. In practice, that means much more than counting vehicles.

    A robust submission normally covers the proposed floorspace, use, hours of operation, staffing numbers, shift patterns, access arrangements, parking strategy, servicing, internal layout, trip generation, distribution by route, junction performance and sustainable travel opportunities. It should also set out the study area, baseline conditions, committed development assumptions and the years being assessed. If the site is sensitive, the TA often sits alongside wider technical work on safety, air quality, noise or an environmental impact assessment.

    For planning teams, the key point is that the TA is not only descriptive: it is evidence-led. It should demonstrate whether the proposed access works, whether nearby junctions can accommodate traffic, whether staff can realistically reach the site, and what mitigation is needed if impacts arise. That usually includes drawings, traffic data, modelling outputs, swept path checks and a clear narrative linking the operation of the building to movement on and off site.

    Done properly, it becomes a decision-making document rather than a box-ticking exercise.

    How These Schemes Differ From Standard Industrial Or Commercial Sites

    Large logistics parks and fulfilment centres behave differently from ordinary industrial estates, and the TA has to reflect that reality. The first difference is intensity. A conventional business park might generate commuter peaks with relatively modest servicing demand. A fulfilment centre can generate sustained HGV flows, concentrated van dispatch activity, shift changes outside traditional peak hours, and operational movements that continue through the night.

    The second difference is timing. Parcel activity often spikes in the evening, while inbound trunking may occur very early or very late. Seasonal pressure can be dramatic too, particularly in the run-up to Christmas or during retail events. Using broad industrial trip rates without interrogating the operating model is one of the quickest ways to undermine credibility.

    The third difference is physical layout. These sites need large yards, dock provision, trailer storage, circulation space and access geometry that can cope with regular articulated vehicle movements. In many cases, automation changes labour demand but increases delivery precision and dispatch frequency.

    So while the principles of a TA are familiar, the content has to be logistics-specific. That is where a generalised transport assessment for methodology needs adapting to the operational complexity of B8 and fulfilment-led schemes.

    When A Full Transport Assessment Is Likely To Be Required

    Infographic of triggers and scoping for a logistics transport assessment in the UK.

    For large-scale logistics proposals, a full TA is often expected rather than optional. Exact thresholds vary by authority, but once a scheme reaches substantial warehouse floorspace, often somewhere from around 5,000 to 10,000 square metres upward, planning teams should assume that transport evidence will be scrutinised closely. And floorspace alone is not the whole story.

    A smaller scheme may still trigger a full assessment if it proposes 24-hour use, sits on a constrained road network, relies on a new priority or signalised access, or is expected to generate material HGV and van traffic. Authorities are particularly alert where a site connects to already pressured roundabouts, passes near residential streets, schools or air quality management areas, or forms part of a wider strategic allocation where cumulative effects matter.

    National guidance still points toward proportionality, but “proportionate” for a fulfilment centre usually means substantial technical work. The likely questions are predictable: what traffic comes when, by what vehicle type, along which routes, and with what effect on safety, operation and amenity? If the answers are not obvious from the application, a fuller TA becomes necessary.

    In practice, teams save time by assuming detailed assessment early rather than trying to backfill evidence after consultation comments land.

    Typical Planning Triggers, Local Authority Expectations, And Scoping

    The best logistics TAs begin with scoping. Before surveys are commissioned and modelling starts, it is worth agreeing the broad rules of the exercise with the local planning authority and, where relevant, the highway authority or National Highways. That early step can settle the study area, survey locations, future assessment years, committed developments, baseline scenarios and modelling approach.

    Typical triggers include local plan thresholds for B8 warehousing, departures from normal operating hours, high employee numbers, substantial HGV routing implications and the need for off-site highway works. Authorities also commonly expect sensitivity to local context: junctions that may look acceptable on a plan can become highly contentious if they are known pressure points in practice.

    Scoping should also clarify whether the TA needs to address only operational impacts or construction traffic as well, and whether a framework Travel Plan, routing strategy or delivery management plan will be expected. On complex sites, we find an end to end transport approach avoids the familiar problem of transport, architecture and servicing being designed in parallel but not quite agreeing with each other.

    One small but important point: agree assumptions in writing where possible. It is much easier to defend a planning submission when the scope was discussed upfront rather than inferred afterwards.

    Core Development Information Needed At The Start

    infographic of key early inputs for a logistics transport assessment.

    Transport work on logistics schemes becomes inefficient very quickly when the basic operational brief is vague. A credible TA needs accurate inputs from the outset, and not just headline floorspace.

    At minimum, the assessment team should have the site location, red-line boundary, proposed use, gross internal or external areas as relevant, building disposition, access points, parking provision, yard layout, loading arrangements, gatehouse strategy, operating hours, forecast employment and shift structure. If the site will be phased, that phasing needs to be explicit. If occupiers are not yet known, the team still needs a realistic parameter-based operating scenario.

    This is where many applications wobble. Architects may be developing a building envelope while the planning team refers to one staffing assumption and the transport team models another. Meanwhile, the operational adviser is talking about trailer storage numbers that do not fit the yard. Those mismatches are avoidable, but only if the project team treats movement planning as core design information rather than a later report-writing exercise.

    We also need to know how the site is meant to function day to day. Are vans loaded on site or dispatched from elsewhere? Will HGVs arrive on timed slots? Is the operation parcel-led, ambient storage, cold-chain, regional distribution, cross-dock or something hybrid? Those details directly shape trip rates and peak profiles.

    For applicants aiming to move quickly, experienced Transport Assessment Consultants: usually add most value right here, when the factual brief is still forming rather than after layouts have hardened.

    Trip Generation, Operating Profiles, And Peak Activity Patterns

    UK logistics transport infographic showing trip peaks, vehicle types, staff shifts, and route splits.

    Trip generation is where a logistics TA either starts to feel site-specific or falls into generic guesswork. A serious assessment should break demand down by vehicle type, hour and direction of travel, and it should reflect the operational profile of the proposed use rather than broad industrial averages.

    For many large warehousing and fulfilment schemes, weekday AM and PM highway peaks are only part of the story. Dispatch and returns activity can intensify later in the day. Some sites experience strong overnight trunking. Weekend operations may be almost as important as weekdays, especially in e-commerce-led fulfilment. Seasonal peaks can also be material, even if the core TA is based on neutral conditions.

    The evidence base for trip generation may include TRICS where suitable, but for specialised logistics proposals it often needs supplementing with operator data, comparable sites, first principles analysis and professional judgement. Planning teams should not be nervous about that. Authorities are generally more persuaded by transparent, reasoned logistics evidence than by a generic database selection that clearly does not match the use.

    The output should be intelligible: what trips occur, when they occur, how they split by mode and route, and which periods should be tested in capacity assessments.

    HGV, Van, Staff, And Shift-Based Travel Demand

    Separating demand streams is essential. HGVs, vans and staff do not behave the same way, and combining them into a single hourly total often hides the issue everyone actually cares about.

    HGV assessment should distinguish articulated and rigid vehicles where relevant, identify inbound and outbound flows, and explain whether movements are appointment-based, wave-based or spread through the day. Van activity may have sharp dispatch peaks tied to order cut-offs and route departures. Staff demand is usually linked to shift starts and finishes, with overlap periods that can create short bursts of parking and access pressure.

    Then there is mode share. On edge-of-settlement logistics sites, staff travel can be heavily car-dependent unless bus provision, shuttle links, cycling infrastructure and shift timing are genuinely workable. Assuming optimistic walking and bus mode shares without evidence tends to invite challenge. A better approach is to start with realistic accessibility conditions, then show what demand management transport: measures could improve outcomes over time.

    The strongest TAs also explain non-standard peaks plainly. If the operational peak does not coincide with the network peak, say so and test both where needed. That sounds obvious, but it is still missed surprisingly often.

    Access Strategy, Junction Capacity, And Highway Impact Testing

    UK logistics site access and junction capacity testing infographic.

    Once trip generation is established, the next question is whether the network can accommodate it. That begins with access strategy. Planning teams need to show that the proposed access arrangement is appropriate for the scale and type of traffic expected, that visibility and geometry are suitable, and that the design aligns with the function of the host road.

    For logistics sites, access design is rarely a minor detail. A priority junction may be adequate in one location and wholly unsuitable in another. Ghost islands, roundabouts, signal control, lane widening or link improvements may all be on the table depending on traffic volumes, speed environment and turning patterns. If the site sits close to an existing junction, interactions between queues and turning traffic have to be thought through carefully.

    Capacity testing should focus on the junctions and links that are genuinely likely to experience material change, including cumulative effects where committed development is relevant. That usually means comparing baseline and future scenarios, with and without development, and assessing practical operation rather than simply quoting a ratio or reserve capacity figure. Queue length, blocking back and resilience matter.

    Where modelling is required, the chosen tool should fit the junction type and local authority expectations. In many cases, Junctions 11 Software remains central to that process, but software outputs are only as reliable as the assumptions behind them.

    A good TA does not stop at “impact is acceptable”. It explains why.

    Servicing, Yard Management, Swept Path Analysis, And On-Site Circulation

    For a fulfilment centre, internal operation is part of transport planning, not a separate afterthought. Local authorities may focus heavily on off-site traffic, but if the yard cannot function safely and efficiently, the problems tend to spill back onto the public highway sooner or later.

    A robust TA should hence explain how HGVs, vans, staff cars, visitors and emergency vehicles move through the site. That includes access control, waiting space, security checks, dock allocation, trailer parking, one-way systems, reversing policy, turning areas and any segregation between pedestrian and vehicle routes. Gatehouse queues deserve particular attention: if they can extend to the site entrance, the effect is immediately a highway concern.

    Swept path analysis is fundamental. It should test the largest design vehicles likely to use the site at all constrained points: the access, internal bends, dock approaches, service yards and any emergency routes. Too often, applications provide a technically possible movement that is not operationally comfortable. Drivers need realistic tolerance, not perfect choreography.

    Yard management also needs narrative detail. How many dock doors are active at peak times? Is trailer storage static or dynamic? Are vans marshalled on site? What happens when arrivals are early? These operational questions can make the difference between a smooth planning process and a long round of revisions.

    On big sites, transport strategy and layout planning need to function almost as one discipline.

    Sustainable Travel, Staff Accessibility, And Travel Plan Measures

    Sustainable travel can feel awkward on remote logistics sites, but that is exactly why it needs proper attention. A weak accessibility case is now one of the most common pressure points in planning discussions for major warehousing proposals, especially where large workforces are expected across early, late or night shifts.

    The first task is to assess what access actually exists. Walking catchments, cycle routes, nearby bus services, rail links, crossing points, footway continuity and personal safety conditions all matter. Then we need to test those options against shift times. A bus route that looks acceptable on a daytime plan may be useless for a 5am start or an 11pm finish.

    The Travel Plan should be practical rather than aspirational. That might include staff shuttle services from nearby stations or town centres, car-sharing systems, secure cycle parking, lockers and showers, discounted public transport, shift coordination with bus operators, EV charging, and targeted monitoring. For some schemes, phased interventions are sensible: start with realistic baseline mode share, then commit to measures that can scale with occupancy.

    There is no point borrowing sustainable transport language from a town-centre office development. Logistics staff accessibility needs a tailored response grounded in actual labour catchments and operational patterns. The same thinking that supports Residential Development Transport or mixed urban schemes does not automatically transfer to an out-of-centre fulfilment park.

    Authorities can accept challenges here, but only if the application is candid and solutions-focused.

    Environmental, Safety, And Amenity Issues Often Reviewed Alongside Transport

    A logistics TA does not sit in isolation. On many applications, transport findings feed directly into wider planning concerns about noise, air quality, carbon, lighting, road safety and residential amenity. Sometimes those topics are covered in separate reports: sometimes they are cross-referenced. Either way, the transport evidence needs to be consistent with them.

    Noise is a classic example. If the TA shows regular night-time HGV arrivals, reversing alarms, trailer movements or van dispatch peaks, that operational pattern may have consequences for acoustic assessment and layout design. Air quality can also become sensitive where a site adds traffic to congested corridors or affects receptors close to access routes. Routeing assumptions hence matter beyond the highway chapter.

    Road safety deserves careful treatment too. Collision data, access visibility, pedestrian crossing demand, cycle conflict points and the behaviour of large vehicles near local streets should all be considered. For sites near settlements, amenity concerns often focus not just on volume but on character: people may tolerate additional traffic more readily than repeated HGV movements at unsocial hours.

    Where a proposal forms part of a larger planning package, consistency with the wider environmental impact assessment narrative is crucial. Contradictions between reports are surprisingly common, and objectors notice them fast.

    The practical lesson is simple: transport assumptions should be shared early across the consultant team, not copied across at the end.

    Common Mistakes In Planning Applications For Logistics Sites

    Most weak logistics TAs do not fail because the authors do not understand transport. They fail because the development has been treated as a generic warehouse instead of a specific operation.

    One common mistake is relying on standard B8 or industrial trip rates that understate HGV or van intensity. That may look neat in a spreadsheet, but it quickly unravels if the occupier model is parcel-led, time-critical or 24/7. Another is assessing only traditional highway peaks and ignoring the actual operational peaks that drive yard pressure, gatehouse queues or local amenity concerns.

    We also see layouts advanced too far before vehicle tracking has been done properly. Then the project team discovers that dock approaches are tight, trailer storage is insufficient, or staff parking conflicts with service circulation. At that stage, fixes are possible, but they are slower and usually more expensive.

    A further weakness is overpromising on sustainable travel. Authorities are increasingly sceptical of optimistic mode shares unsupported by local conditions, particularly on edge-of-town sites with sparse public transport. Better to present a grounded baseline with targeted improvement measures than a glossy but brittle narrative.

    And finally, there is the coordination problem. If planning, architecture, highways and operations are not aligned, inconsistencies creep in everywhere. That is why logistics schemes benefit from a genuinely integrated end to end process rather than a late-stage report assembled from half-settled assumptions.

    Conclusion

    A successful transport assessment for a large logistics, warehousing or fulfilment scheme has to do more than satisfy a validation checklist. It needs to show, convincingly and in operational terms, that the proposal can function on site and within the wider network without unacceptable effects.

    In 2026, the schemes that move more smoothly through planning are usually the ones built around realistic logistics evidence: clear trip profiles by vehicle type, honest treatment of shift and night-time activity, well-tested access and junction performance, workable yard circulation, and a staff accessibility strategy that reflects how people actually travel. Get those elements right early, and the TA becomes a tool for design and decision-making rather than damage control.

    For planning teams, that is the real opportunity. A logistics-specific assessment does not just answer objections after they appear: it helps shape a scheme that is safer, more efficient and easier to consent in the first place.

    Frequently Asked Questions about Large-Scale Logistics Transport Assessments

    What is a Large-Scale Logistics, Warehousing and Fulfilment Centre Transport Assessment?

    It is a detailed evidence-based report explaining how a logistics or fulfilment centre will generate and manage transport impacts, covering vehicle trips, access design, junction capacity, staffing shifts, and sustainable travel measures to support planning applications.

    Why do logistics transport assessments differ from standard industrial site assessments?

    Logistics centres involve higher HGV and van activity, operate often 24/7, have complex shift patterns, and require specialized yards and access designs, making their transport assessments more detailed and specific than typical industrial sites.

    When is a full Transport Assessment usually required for a logistics development?

    A full Transport Assessment is typically needed for logistics sites with floorspace over around 5,000 to 10,000 m², especially if they have 24-hour operations, sensitive access points, or generate substantial HGV and van traffic affecting local highway networks.

    How does a Transport Assessment address shift patterns and peak transport demand for fulfilment centres?

    It separates vehicle and staff trip profiles by time and type, capturing peaks outside traditional rush hours, including night-time and seasonal variations, to accurately reflect operational realities and impacts on the transport network.

    What role does swept path analysis play in logistics transport assessments?

    Swept path analysis verifies that large vehicles like articulated HGVs can safely manoeuvre through access points, loading docks, and yards, ensuring that internal circulation and vehicle movements are realistically accommodated in the site design.

    How are sustainable travel and staff accessibility managed in logistics transport assessments?

    Assessments evaluate actual walking, cycling, and public transport availability relative to shift times, proposing practical Travel Plan measures such as shuttle buses, car-sharing, and cycling facilities tailored to off-peak shifts and remote locations.

  • Hyperscale And Colocation Data Centre Transport Assessment: What Planning Teams Need To Get Right In 2026

    Hyperscale And Colocation Data Centre Transport Assessment: What Planning Teams Need To Get Right In 2026

    Planning teams already know the headline point: data centres don’t behave like offices, warehouses, or standard industrial estates. But that’s exactly why transport work around them is often misunderstood. A hyperscale campus can involve huge construction volumes and surprisingly low day-to-day staffing. A colocation scheme may look similar on a site plan, yet generate a steadier stream of contractor visits, client access, and phased fit-out activity. If those differences are flattened into generic assumptions, planning risk rises quickly.

    In 2026, that risk is sharper. Local planning authorities are asking harder questions about HGV routing, construction impacts, staff travel realism, and whether the submitted evidence genuinely reflects how the facility will be built and run. A weak transport narrative can slow determination, trigger objections from highways officers, or create awkward inconsistencies with environmental and design documents.

    Our view is simple: a strong Hyperscale and Colocation Data Centre Transport Assessment must be phased, site-specific, and practical. It should explain not just trip numbers, but how traffic will actually be managed on the ground, during earthworks, fit-out, operation, maintenance, and occasional abnormal load movements. When that work is done properly, it gives planners, architects, lawyers, developers, and councils a much clearer path through the application process.

    Key Takeaways

    • A robust Hyperscale and Colocation Data Centre Transport Assessment must be phased, site-specific, and practical, detailing traffic management throughout construction, operation, and maintenance phases.
    • Construction traffic is the most sensitive phase requiring detailed management plans for HGV routing, timing restrictions, and on-site controls to prevent network disruption and community objections.
    • Hyperscale and colocation data centres create distinct transport demands; hyperscale sites have low staff trip rates but require specialist servicing assessments, while colocation sites need detailed tenant and contractor trip forecasting.
    • Access strategies must accommodate secure entry, large vehicles, and internal circulation with thorough junction performance analysis reflecting real traffic profiles across all phases.
    • Transport assessments should align closely with the wider planning submission, including masterplans, environmental reports, and travel plans, to ensure internal consistency and reduce approval delays.
    • Demonstrating credible sustainable travel measures and clear HGV routing plans is essential to address local authority concerns and avoid objections during planning determination.

    Why Transport Assessment Matters For Data Centre Planning Applications

    UK data centre transport assessment infographic showing traffic impacts, access, and mitigation.

    A transport assessment is rarely a box-ticking exercise for data centre schemes. It is one of the documents that determines whether the project feels credible to a local authority. For hyperscale and colocation proposals, that matters because the transport profile is unusual: low employment density, high servicing sensitivity, and a construction phase that can be far more intense than the eventual operational use.

    The purpose is straightforward. We need to demonstrate that construction and operational traffic can be accommodated safely, that the residual cumulative effect on the network would not be severe, and that realistic mitigation has been built into the scheme from the outset. That includes access design, junction assessment, internal circulation, travel planning, and delivery controls.

    For many authorities, the transport case also becomes the place where wider concerns are tested. Will HGVs pass through villages? Will shift traffic coincide with school peaks? Can large plant deliveries enter and leave without blocking the network? Those questions often sit alongside the broader principles set out in a transport assessment for planning submission, but data centres demand more tailored assumptions.

    In practice, a good assessment reduces uncertainty. That is often the difference between a scheme progressing smoothly and one that spends months answering avoidable technical queries.

    How Hyperscale And Colocation Schemes Create Different Transport Demands

    Comparison infographic of hyperscale and colocation data centre transport patterns in the UK.

    This is where many reports either win trust or lose it.

    Hyperscale facilities are usually large, highly automated, and operated by a single major user or cloud provider. Their built form can be vast, power demand substantial, and security strict, yet everyday staffing levels are typically modest for the amount of floorspace involved. As a result, the long-term transport picture is often shaped less by commuter demand and more by specialist servicing, facilities management, security, and occasional high-value equipment movements.

    Colocation schemes tend to be more varied. Because they host multiple customers, they often see a broader mix of occupier-related access, contractor attendance, rack migrations, staged fit-outs, and periodic technology refreshes. The total staff count may still be low compared with mainstream employment uses, but trip patterns can be less predictable and more operationally diverse.

    That difference matters for forecasting. A hyperscale site may justify very low employee trip rates but require robust assessment of plant replacement and backup infrastructure deliveries. A colocation site may need a finer-grained explanation of tenant visits, van traffic, and ongoing churn within occupied suites.

    We usually advise teams not to rely on generic B8, office, or industrial proxies unless there is a clear reason. Highways officers are increasingly alive to the distinction, and the quality of benchmarking, plus the experience of the Transport Assessment Consultants: preparing the evidence, can shape how quickly those assumptions are accepted.

    Key Trip Generation Drivers Across Construction, Operation, And Maintenance

    Data centre transport trips shown across construction, operation, and maintenance phases.

    For a robust Hyperscale and Colocation Data Centre Transport Assessment, trip generation should be broken down by phase rather than treated as a single blended number.

    Construction is usually the dominant issue. Early stages may involve bulk excavation, cut-and-fill, piling, drainage, utilities, and concrete pours. Then come steel or structural frame deliveries, envelope materials, mechanical and electrical plant, generators, transformers, chillers, fuel systems, and highly coordinated data hall fit-out. Workforce travel can also be significant, especially where labour is drawn from a wide catchment and public transport is limited.

    Operation is a different story. Daily staff arrivals are often modest and spread across shifts. Security, facilities management, cleaning, limited administration, and engineering personnel tend to form the core. Visitor demand is normally low, but not always negligible, particularly at colocation sites.

    Maintenance introduces another layer. Planned inspections, reactive call-outs, software and hardware support, plant servicing, waste collections, fuel deliveries for testing regimes, and periodic IT refresh cycles all create movement. Individually, many of those trips are small in number. Collectively, they still need a transparent methodology.

    The best assessments explain what drives each category, state assumptions clearly, and tie them back to programme, staffing plans, servicing schedules, and realistic comparators, not optimistic guesswork.

    Construction Traffic: The Most Sensitive Phase In Many Data Centre Schemes

    Data centre transport infographic showing construction peaks, staff travel, and servicing trips.

    For most data centre applications, construction is the phase that draws the closest scrutiny, and rightly so. The completed facility may generate relatively few daily person trips, but the build programme can place substantial pressure on local roads if it is not properly planned.

    The peak is not constant across the programme. Earthworks and remediation can produce heavy outbound and inbound HGV flows. Structural phases bring concrete wagons, steel deliveries, cranage logistics, and a sizeable contractor workforce. M&E installation and fit-out then introduce specialist vans, supplier vehicles, and occasional large plant movements. On multi-building campuses, those peaks can repeat in waves.

    That is why we normally treat construction transport as a live management issue, not just a forecast table in an appendix. Routing, timing restrictions, marshal arrangements, contractor parking controls, wheel washing, booking systems, and on-site holding areas all need to be considered early. If neighbouring strategic employment schemes are also coming forward, cumulative construction traffic can become a material issue very quickly.

    Where significant effects may arise, the transport evidence should sit consistently with any environmental impact assessment work, especially around noise, air quality, and the assessed construction programme.

    And bluntly, if the build phase looks undercooked, the whole submission tends to look undercooked too.

    Staffing, Shift Patterns, And Low-Occupancy Operational Travel

    Operational travel often appears simple because staff numbers are low. In reality, authorities still want a credible explanation of who comes to site, when they arrive, and how those movements fit local conditions.

    Hyperscale facilities are classic low-occupancy, high-floorspace uses. A very large building can operate with a relatively compact staffing model because monitoring, control systems, and building management functions are highly automated. Even so, the assessment should set out staffing by role and by shift: operations, engineering, security, management, cleaning, and facilities teams. Arrival and departure profiles matter more than annual headcount.

    We also need to be realistic about mode share. Peripheral sites with weak bus links and fragmented footways are unlikely to support ambitious non-car assumptions unless practical measures are in place. Car sharing, staggered starts, shuttle links to stations, EV charging, and secure cycle facilities can all help, but only where they align with actual workforce patterns.

    Parking provision is part of that narrative. Too little, and overspill concerns emerge. Too much, and sustainable travel claims can look hollow. The balance should reflect a site-specific staff profile rather than generic employment standards.

    Servicing, Maintenance Visits, And Specialist Contractor Movements

    Operational traffic at a data centre is not just staff cars. In many schemes, servicing and specialist contractor movements are the more distinctive element.

    Routine activity can include consumables, waste collection, building maintenance, FM support, security servicing, water treatment visits, and fuel management linked to backup generation regimes. Colocation sites may also have a more regular flow of customer-side engineers, IT deployment teams, and small hardware deliveries.

    Then there are periodic spikes. Plant replacement, battery upgrades, switchgear work, cooling infrastructure renewal, and major server or rack migration events can all generate short bursts of van, rigid, or articulated vehicle activity. These events do not occur every day, but omitting them entirely weakens the credibility of the assessment.

    The cleanest approach is to distinguish among car trips, LGV and van trips, standard HGV servicing, and abnormal or escorted loads. Once those categories are separated, it becomes much easier to explain likely frequency, routeing, on-site handling, and any need for management controls.

    Access Strategy, Highway Capacity, And Junction Performance

    Infographic of UK data centre access, junction capacity, and vehicle movement assessment.

    Access design for a data centre has to work harder than a typical commercial access. We are usually accommodating secure entry arrangements, occasional large vehicles, staff traffic, emergency access, and internal circulation that avoids conflict between cars, vans, and HGVs.

    The primary access point should be tested for visibility, geometry, entry stacking, gatehouse operation where relevant, and the ability of articulated vehicles to enter and leave without overrunning or causing delay on the public highway. Separate staff and service accesses can be helpful on larger campuses, but only if they genuinely improve operation and do not create extra complexity.

    Junction performance then needs to be assessed in a way that reflects the project’s real traffic profile. For construction, that may mean testing worst-case HGV and workforce periods. For operation, standard weekday AM and PM peaks are still common, but sensitive local peaks, schools, shift changes, town centre constraints, may be just as important.

    Accepted tools matter here. Depending on junction type and context, assessments may rely on priority, roundabout, signal, or network modelling, often supported by Junctions 11 Software and broader Capacity Assessment Traffic methods. The key point is not the software brand: it is whether the modelling assumptions, scenarios, and mitigation logic are transparent and defensible.

    If the access strategy is unresolved at application stage, questions multiply fast.

    Walking, Cycling, Public Transport, And Sustainable Travel Expectations

    A common mistake is to assume sustainable travel barely matters because data centres have low staffing levels. Planning policy rarely lets us take that shortcut.

    Even for peripheral or semi-rural sites, authorities generally expect applicants to assess walking, cycling, and public transport conditions properly and to show that reasonable opportunities have been considered. That does not mean pretending the site behaves like a city-centre office. It means being honest about current constraints and proportionate about improvements.

    Walking routes should be tested for continuity, lighting, crossing opportunities, gradients, and practical connections to nearby settlements or employment areas. Cycling provision should cover safe access, secure parking, showers, lockers, and where relevant e-bike charging. Public transport analysis should address service frequency, span of service, reliability, and whether shift times align with real timetables rather than theoretical availability.

    Where accessibility is limited, mitigation can still be credible: staff shuttles to rail stations, lift-share platforms, travel plan coordinators, protected cycle links, or contributions to service enhancements. A framework travel plan is often the right mechanism, particularly for phased campuses.

    Interestingly, lessons from Residential Development Transport work can help here too, not because the land use is similar, but because the discipline of proving realistic mode choice is exactly the same.

    HGV Routing, Abnormal Loads, And Delivery Management Planning

    If there is one issue that can trigger local concern fastest, it is HGV routing.

    Data centre schemes often depend on strategic road access, and for good reason. Construction materials, generators, transformers, chillers, fuel systems, and large M&E components are not movements we want filtering through constrained residential streets or village centres. The preferred route strategy hence needs to be explicit, mapped, and realistic. Vague wording about drivers being “encouraged” to use suitable roads is rarely enough.

    For standard HGVs, the assessment should identify approach routes, any prohibited links, temporary signage needs, and how compliance will be managed through contractor induction, booking systems, and haulage instructions. For abnormal indivisible loads, more detail is usually needed: swept path testing, bridge or structure constraints, street furniture checks, timing windows, and liaison with highway authorities or police where required.

    Delivery management is the practical backbone of all this. Time slots, caps on arrivals, on-site waiting space, gate protocols, and contingency arrangements help prevent queuing back onto the highway. On large campuses, a digital booking system is often worth specifying from the outset.

    This is one of those areas where planning committees often read the summary, not the technical appendix. So the strategy needs to be clear enough that a non-transport audience can still understand how risk is being controlled.

    Evidence, Surveys, And Modelling Needed To Support A Robust Assessment

    The quality of a Hyperscale and Colocation Data Centre Transport Assessment is only as good as the evidence behind it. If the baseline is weak, every later assumption becomes easier to challenge.

    We generally start with recent traffic counts, turning counts at key junctions, queue observations where congestion is sensitive, speed data where access visibility matters, and a current review of road safety records. For some sites, school-time conditions or seasonal patterns also need to be captured because they materially affect local acceptability.

    Trip generation evidence should then be phase-specific. Construction forecasts should be linked to material quantities, programme sequencing, vehicle types, workforce estimates, and expected peak periods. Operational forecasts should reflect staffing rosters, building management assumptions, servicing frequencies, and, where used, carefully selected comparison sites.

    Modelling should normally test baseline, committed development, and development scenarios for opening and future years. If multiple plots or phases may come forward, sensitivity testing is often sensible. That broader methodology mirrors what we expect from a strong transport assessment for major schemes, but data centres often need sharper distinction between temporary and permanent impacts.

    The important thing is not volume of data for its own sake. It is whether the evidence genuinely answers the questions the authority is likely to ask.

    Common Planning Risks And Reasons Data Centre Transport Submissions Are Challenged

    Most challenged submissions do not fail because data centres are impossible to assess. They fail because the evidence leaves obvious gaps.

    One recurring problem is underestimating construction traffic, especially HGVs linked to earthworks, concrete, and large plant deliveries. Another is ignoring overlap with nearby development programmes, which can make a “modest” individual impact look very different in cumulative terms.

    A second weakness is unclear routing. If the assessment does not identify how HGVs will avoid sensitive roads, or if abnormal loads are mentioned only in passing, objections from local communities and highways officers are predictable.

    Mode share can be another sticking point. We sometimes see optimistic assumptions about bus or cycle use on isolated sites with poor infrastructure and shift patterns that simply do not support those choices. Authorities usually spot that quickly.

    Technical inconsistencies also cause trouble. The traffic flows in the TA should match the wider planning package, including programme assumptions, access drawings, and any environmental impact assessment transport: evidence. If one document describes a peak construction phase that another barely acknowledges, confidence drops.

    The lesson is simple enough: challenge tends to arise where submissions are generic, thin on management detail, or internally inconsistent.

    How To Align The Transport Assessment With The Wider Planning Submission

    A transport assessment works best when it is clearly woven into the wider planning story rather than appended at the end.

    That starts with the masterplan. Access points, internal roads, tracking layouts, parking, service yards, and gatehouse arrangements should match the drawings exactly. Small discrepancies, one extra access arm, a different parking total, a yard dimension that no longer accommodates turning, can create disproportionate delay during determination.

    The TA should also align with the planning statement and design narrative. If the application promotes high-quality placemaking, secure active travel routes, or a carefully managed campus environment, the transport document should demonstrate how those outcomes are delivered in physical and operational terms.

    Construction assumptions need to align with programme and environmental documents. If the environmental team has assessed a 24-month build with peak HGV activity in year one, the transport case should not quietly assume something gentler. Likewise, drainage, landscape, utilities, and energy strategies can all affect access corridors, compound space, and delivery patterns.

    For planning teams, consistency is often the hidden time-saver. With the right technical lead and the discipline of experienced Transport Assessment Consultants:, the TA becomes evidence that supports the whole submission, not a separate report that everyone else has to explain away.

    Conclusion

    A well-prepared Hyperscale and Colocation Data Centre Transport Assessment does more than estimate trips. It explains how a complex, high-value facility will be built, accessed, serviced, and managed without creating unacceptable effects on the surrounding network.

    In our experience, the strongest submissions are phased, evidence-led, and honest about where the real transport sensitivity sits, usually in construction logistics, HGV routing, and the practicalities of low-occupancy but specialist operational travel. They also stay aligned with the rest of the planning package, from access drawings to environmental reporting and travel plan commitments.

    For architects, planners, lawyers, developers, surveyors, councils, and project teams, that is the real goal in 2026: not a generic report, but a transport case that answers likely objections before they become delays. When the assessment is specific, coordinated, and grounded in how the site will actually function, planning decisions tend to become much easier to defend.

    Frequently Asked Questions about Hyperscale and Colocation Data Centre Transport Assessment

    Why is a transport assessment essential for hyperscale and colocation data centre planning applications?

    A transport assessment demonstrates that construction and operational traffic can be safely managed without causing severe impacts on local networks. It informs access strategies, junction design, and mitigation measures, providing evidence to local authorities about HGV routing, congestion, and safety concerns.

    How do transport demands differ between hyperscale and colocation data centres?

    Hyperscale data centres typically involve a single user with large floorspace but low staffing, leading to trip patterns dominated by construction and specialist servicing. Colocation centres have multiple tenants, resulting in more diverse contractor visits, client access, and ongoing fit-out activity with higher operational traffic variability.

    What are the key trip generation factors during the construction and operation of data centres?

    Construction trips include earthworks, bulk material deliveries, and plant fit-out, often peaking with HGV flows. Operational trips mostly involve staff shifts, security, maintenance visits, routine deliveries, and periodic IT refreshes. Each phase requires distinct transport planning and assessment to capture realistic movements.

    How can HGV routing and abnormal load management reduce community impact during data centre construction?

    Clear routing strategies using strategic roads and avoiding sensitive residential areas are critical. Abnormal loads need swept path analysis and timed movements, often off-peak. Delivery management systems with booking, time windows, and on-site holding prevent highway queuing and address local concerns effectively.

    What sustainable travel measures are relevant for data centre transport assessments despite typically low staffing levels?

    Planning expects assessments of walking, cycling, and public transport accessibility, with provisions like secure cycle parking, showers, shuttle services to stations, and travel plans with mode share targets. These measures align with realistic site constraints and support sustainable staff travel options.

    What common pitfalls cause objections to data centre transport assessments, and how can they be avoided?

    Common issues include underestimating construction HGV volumes, unclear vehicle routing, optimistic staff mode share assumptions without controls, and inconsistencies between transport, environmental, and design documents. Avoiding these requires phased, evidence-based assessments aligned with the entire planning submission.

  • Hyperscale And Colocation Data Centre Transport Assessment: What Planning Teams Need To Get Right In 2026

    Hyperscale And Colocation Data Centre Transport Assessment: What Planning Teams Need To Get Right In 2026

    Planning teams already know the headline point: data centres don’t behave like offices, warehouses, or standard industrial estates. But that’s exactly why transport work around them is often misunderstood. A hyperscale campus can involve huge construction volumes and surprisingly low day-to-day staffing. A colocation scheme may look similar on a site plan, yet generate a steadier stream of contractor visits, client access, and phased fit-out activity. If those differences are flattened into generic assumptions, planning risk rises quickly.

    In 2026, that risk is sharper. Local planning authorities are asking harder questions about HGV routing, construction impacts, staff travel realism, and whether the submitted evidence genuinely reflects how the facility will be built and run. A weak transport narrative can slow determination, trigger objections from highways officers, or create awkward inconsistencies with environmental and design documents.

    Our view is simple: a strong Hyperscale and Colocation Data Centre Transport Assessment must be phased, site-specific, and practical. It should explain not just trip numbers, but how traffic will actually be managed on the ground, during earthworks, fit-out, operation, maintenance, and occasional abnormal load movements. When that work is done properly, it gives planners, architects, lawyers, developers, and councils a much clearer path through the application process.

    Key Takeaways

    • A robust Hyperscale and Colocation Data Centre Transport Assessment must be phased, site-specific, and practical, detailing traffic management throughout construction, operation, and maintenance phases.
    • Construction traffic is the most sensitive phase requiring detailed management plans for HGV routing, timing restrictions, and on-site controls to prevent network disruption and community objections.
    • Hyperscale and colocation data centres create distinct transport demands; hyperscale sites have low staff trip rates but require specialist servicing assessments, while colocation sites need detailed tenant and contractor trip forecasting.
    • Access strategies must accommodate secure entry, large vehicles, and internal circulation with thorough junction performance analysis reflecting real traffic profiles across all phases.
    • Transport assessments should align closely with the wider planning submission, including masterplans, environmental reports, and travel plans, to ensure internal consistency and reduce approval delays.
    • Demonstrating credible sustainable travel measures and clear HGV routing plans is essential to address local authority concerns and avoid objections during planning determination.

    Why Transport Assessment Matters For Data Centre Planning Applications

    UK data centre transport assessment infographic showing traffic impacts, access, and mitigation.

    A transport assessment is rarely a box-ticking exercise for data centre schemes. It is one of the documents that determines whether the project feels credible to a local authority. For hyperscale and colocation proposals, that matters because the transport profile is unusual: low employment density, high servicing sensitivity, and a construction phase that can be far more intense than the eventual operational use.

    The purpose is straightforward. We need to demonstrate that construction and operational traffic can be accommodated safely, that the residual cumulative effect on the network would not be severe, and that realistic mitigation has been built into the scheme from the outset. That includes access design, junction assessment, internal circulation, travel planning, and delivery controls.

    For many authorities, the transport case also becomes the place where wider concerns are tested. Will HGVs pass through villages? Will shift traffic coincide with school peaks? Can large plant deliveries enter and leave without blocking the network? Those questions often sit alongside the broader principles set out in a transport assessment for planning submission, but data centres demand more tailored assumptions.

    In practice, a good assessment reduces uncertainty. That is often the difference between a scheme progressing smoothly and one that spends months answering avoidable technical queries.

    How Hyperscale And Colocation Schemes Create Different Transport Demands

    Comparison infographic of hyperscale and colocation data centre transport patterns in the UK.

    This is where many reports either win trust or lose it.

    Hyperscale facilities are usually large, highly automated, and operated by a single major user or cloud provider. Their built form can be vast, power demand substantial, and security strict, yet everyday staffing levels are typically modest for the amount of floorspace involved. As a result, the long-term transport picture is often shaped less by commuter demand and more by specialist servicing, facilities management, security, and occasional high-value equipment movements.

    Colocation schemes tend to be more varied. Because they host multiple customers, they often see a broader mix of occupier-related access, contractor attendance, rack migrations, staged fit-outs, and periodic technology refreshes. The total staff count may still be low compared with mainstream employment uses, but trip patterns can be less predictable and more operationally diverse.

    That difference matters for forecasting. A hyperscale site may justify very low employee trip rates but require robust assessment of plant replacement and backup infrastructure deliveries. A colocation site may need a finer-grained explanation of tenant visits, van traffic, and ongoing churn within occupied suites.

    We usually advise teams not to rely on generic B8, office, or industrial proxies unless there is a clear reason. Highways officers are increasingly alive to the distinction, and the quality of benchmarking, plus the experience of the Transport Assessment Consultants: preparing the evidence, can shape how quickly those assumptions are accepted.

    Key Trip Generation Drivers Across Construction, Operation, And Maintenance

    Data centre transport trips shown across construction, operation, and maintenance phases.

    For a robust Hyperscale and Colocation Data Centre Transport Assessment, trip generation should be broken down by phase rather than treated as a single blended number.

    Construction is usually the dominant issue. Early stages may involve bulk excavation, cut-and-fill, piling, drainage, utilities, and concrete pours. Then come steel or structural frame deliveries, envelope materials, mechanical and electrical plant, generators, transformers, chillers, fuel systems, and highly coordinated data hall fit-out. Workforce travel can also be significant, especially where labour is drawn from a wide catchment and public transport is limited.

    Operation is a different story. Daily staff arrivals are often modest and spread across shifts. Security, facilities management, cleaning, limited administration, and engineering personnel tend to form the core. Visitor demand is normally low, but not always negligible, particularly at colocation sites.

    Maintenance introduces another layer. Planned inspections, reactive call-outs, software and hardware support, plant servicing, waste collections, fuel deliveries for testing regimes, and periodic IT refresh cycles all create movement. Individually, many of those trips are small in number. Collectively, they still need a transparent methodology.

    The best assessments explain what drives each category, state assumptions clearly, and tie them back to programme, staffing plans, servicing schedules, and realistic comparators, not optimistic guesswork.

    Construction Traffic: The Most Sensitive Phase In Many Data Centre Schemes

    Data centre transport infographic showing construction peaks, staff travel, and servicing trips.

    For most data centre applications, construction is the phase that draws the closest scrutiny, and rightly so. The completed facility may generate relatively few daily person trips, but the build programme can place substantial pressure on local roads if it is not properly planned.

    The peak is not constant across the programme. Earthworks and remediation can produce heavy outbound and inbound HGV flows. Structural phases bring concrete wagons, steel deliveries, cranage logistics, and a sizeable contractor workforce. M&E installation and fit-out then introduce specialist vans, supplier vehicles, and occasional large plant movements. On multi-building campuses, those peaks can repeat in waves.

    That is why we normally treat construction transport as a live management issue, not just a forecast table in an appendix. Routing, timing restrictions, marshal arrangements, contractor parking controls, wheel washing, booking systems, and on-site holding areas all need to be considered early. If neighbouring strategic employment schemes are also coming forward, cumulative construction traffic can become a material issue very quickly.

    Where significant effects may arise, the transport evidence should sit consistently with any environmental impact assessment work, especially around noise, air quality, and the assessed construction programme.

    And bluntly, if the build phase looks undercooked, the whole submission tends to look undercooked too.

    Staffing, Shift Patterns, And Low-Occupancy Operational Travel

    Operational travel often appears simple because staff numbers are low. In reality, authorities still want a credible explanation of who comes to site, when they arrive, and how those movements fit local conditions.

    Hyperscale facilities are classic low-occupancy, high-floorspace uses. A very large building can operate with a relatively compact staffing model because monitoring, control systems, and building management functions are highly automated. Even so, the assessment should set out staffing by role and by shift: operations, engineering, security, management, cleaning, and facilities teams. Arrival and departure profiles matter more than annual headcount.

    We also need to be realistic about mode share. Peripheral sites with weak bus links and fragmented footways are unlikely to support ambitious non-car assumptions unless practical measures are in place. Car sharing, staggered starts, shuttle links to stations, EV charging, and secure cycle facilities can all help, but only where they align with actual workforce patterns.

    Parking provision is part of that narrative. Too little, and overspill concerns emerge. Too much, and sustainable travel claims can look hollow. The balance should reflect a site-specific staff profile rather than generic employment standards.

    Servicing, Maintenance Visits, And Specialist Contractor Movements

    Operational traffic at a data centre is not just staff cars. In many schemes, servicing and specialist contractor movements are the more distinctive element.

    Routine activity can include consumables, waste collection, building maintenance, FM support, security servicing, water treatment visits, and fuel management linked to backup generation regimes. Colocation sites may also have a more regular flow of customer-side engineers, IT deployment teams, and small hardware deliveries.

    Then there are periodic spikes. Plant replacement, battery upgrades, switchgear work, cooling infrastructure renewal, and major server or rack migration events can all generate short bursts of van, rigid, or articulated vehicle activity. These events do not occur every day, but omitting them entirely weakens the credibility of the assessment.

    The cleanest approach is to distinguish among car trips, LGV and van trips, standard HGV servicing, and abnormal or escorted loads. Once those categories are separated, it becomes much easier to explain likely frequency, routeing, on-site handling, and any need for management controls.

    Access Strategy, Highway Capacity, And Junction Performance

    Infographic of UK data centre access, junction capacity, and vehicle movement assessment.

    Access design for a data centre has to work harder than a typical commercial access. We are usually accommodating secure entry arrangements, occasional large vehicles, staff traffic, emergency access, and internal circulation that avoids conflict between cars, vans, and HGVs.

    The primary access point should be tested for visibility, geometry, entry stacking, gatehouse operation where relevant, and the ability of articulated vehicles to enter and leave without overrunning or causing delay on the public highway. Separate staff and service accesses can be helpful on larger campuses, but only if they genuinely improve operation and do not create extra complexity.

    Junction performance then needs to be assessed in a way that reflects the project’s real traffic profile. For construction, that may mean testing worst-case HGV and workforce periods. For operation, standard weekday AM and PM peaks are still common, but sensitive local peaks, schools, shift changes, town centre constraints, may be just as important.

    Accepted tools matter here. Depending on junction type and context, assessments may rely on priority, roundabout, signal, or network modelling, often supported by Junctions 11 Software and broader Capacity Assessment Traffic methods. The key point is not the software brand: it is whether the modelling assumptions, scenarios, and mitigation logic are transparent and defensible.

    If the access strategy is unresolved at application stage, questions multiply fast.

    Walking, Cycling, Public Transport, And Sustainable Travel Expectations

    A common mistake is to assume sustainable travel barely matters because data centres have low staffing levels. Planning policy rarely lets us take that shortcut.

    Even for peripheral or semi-rural sites, authorities generally expect applicants to assess walking, cycling, and public transport conditions properly and to show that reasonable opportunities have been considered. That does not mean pretending the site behaves like a city-centre office. It means being honest about current constraints and proportionate about improvements.

    Walking routes should be tested for continuity, lighting, crossing opportunities, gradients, and practical connections to nearby settlements or employment areas. Cycling provision should cover safe access, secure parking, showers, lockers, and where relevant e-bike charging. Public transport analysis should address service frequency, span of service, reliability, and whether shift times align with real timetables rather than theoretical availability.

    Where accessibility is limited, mitigation can still be credible: staff shuttles to rail stations, lift-share platforms, travel plan coordinators, protected cycle links, or contributions to service enhancements. A framework travel plan is often the right mechanism, particularly for phased campuses.

    Interestingly, lessons from Residential Development Transport work can help here too, not because the land use is similar, but because the discipline of proving realistic mode choice is exactly the same.

    HGV Routing, Abnormal Loads, And Delivery Management Planning

    If there is one issue that can trigger local concern fastest, it is HGV routing.

    Data centre schemes often depend on strategic road access, and for good reason. Construction materials, generators, transformers, chillers, fuel systems, and large M&E components are not movements we want filtering through constrained residential streets or village centres. The preferred route strategy hence needs to be explicit, mapped, and realistic. Vague wording about drivers being “encouraged” to use suitable roads is rarely enough.

    For standard HGVs, the assessment should identify approach routes, any prohibited links, temporary signage needs, and how compliance will be managed through contractor induction, booking systems, and haulage instructions. For abnormal indivisible loads, more detail is usually needed: swept path testing, bridge or structure constraints, street furniture checks, timing windows, and liaison with highway authorities or police where required.

    Delivery management is the practical backbone of all this. Time slots, caps on arrivals, on-site waiting space, gate protocols, and contingency arrangements help prevent queuing back onto the highway. On large campuses, a digital booking system is often worth specifying from the outset.

    This is one of those areas where planning committees often read the summary, not the technical appendix. So the strategy needs to be clear enough that a non-transport audience can still understand how risk is being controlled.

    Evidence, Surveys, And Modelling Needed To Support A Robust Assessment

    The quality of a Hyperscale and Colocation Data Centre Transport Assessment is only as good as the evidence behind it. If the baseline is weak, every later assumption becomes easier to challenge.

    We generally start with recent traffic counts, turning counts at key junctions, queue observations where congestion is sensitive, speed data where access visibility matters, and a current review of road safety records. For some sites, school-time conditions or seasonal patterns also need to be captured because they materially affect local acceptability.

    Trip generation evidence should then be phase-specific. Construction forecasts should be linked to material quantities, programme sequencing, vehicle types, workforce estimates, and expected peak periods. Operational forecasts should reflect staffing rosters, building management assumptions, servicing frequencies, and, where used, carefully selected comparison sites.

    Modelling should normally test baseline, committed development, and development scenarios for opening and future years. If multiple plots or phases may come forward, sensitivity testing is often sensible. That broader methodology mirrors what we expect from a strong transport assessment for major schemes, but data centres often need sharper distinction between temporary and permanent impacts.

    The important thing is not volume of data for its own sake. It is whether the evidence genuinely answers the questions the authority is likely to ask.

    Common Planning Risks And Reasons Data Centre Transport Submissions Are Challenged

    Most challenged submissions do not fail because data centres are impossible to assess. They fail because the evidence leaves obvious gaps.

    One recurring problem is underestimating construction traffic, especially HGVs linked to earthworks, concrete, and large plant deliveries. Another is ignoring overlap with nearby development programmes, which can make a “modest” individual impact look very different in cumulative terms.

    A second weakness is unclear routing. If the assessment does not identify how HGVs will avoid sensitive roads, or if abnormal loads are mentioned only in passing, objections from local communities and highways officers are predictable.

    Mode share can be another sticking point. We sometimes see optimistic assumptions about bus or cycle use on isolated sites with poor infrastructure and shift patterns that simply do not support those choices. Authorities usually spot that quickly.

    Technical inconsistencies also cause trouble. The traffic flows in the TA should match the wider planning package, including programme assumptions, access drawings, and any environmental impact assessment transport: evidence. If one document describes a peak construction phase that another barely acknowledges, confidence drops.

    The lesson is simple enough: challenge tends to arise where submissions are generic, thin on management detail, or internally inconsistent.

    How To Align The Transport Assessment With The Wider Planning Submission

    A transport assessment works best when it is clearly woven into the wider planning story rather than appended at the end.

    That starts with the masterplan. Access points, internal roads, tracking layouts, parking, service yards, and gatehouse arrangements should match the drawings exactly. Small discrepancies, one extra access arm, a different parking total, a yard dimension that no longer accommodates turning, can create disproportionate delay during determination.

    The TA should also align with the planning statement and design narrative. If the application promotes high-quality placemaking, secure active travel routes, or a carefully managed campus environment, the transport document should demonstrate how those outcomes are delivered in physical and operational terms.

    Construction assumptions need to align with programme and environmental documents. If the environmental team has assessed a 24-month build with peak HGV activity in year one, the transport case should not quietly assume something gentler. Likewise, drainage, landscape, utilities, and energy strategies can all affect access corridors, compound space, and delivery patterns.

    For planning teams, consistency is often the hidden time-saver. With the right technical lead and the discipline of experienced Transport Assessment Consultants:, the TA becomes evidence that supports the whole submission, not a separate report that everyone else has to explain away.

    Conclusion

    A well-prepared Hyperscale and Colocation Data Centre Transport Assessment does more than estimate trips. It explains how a complex, high-value facility will be built, accessed, serviced, and managed without creating unacceptable effects on the surrounding network.

    In our experience, the strongest submissions are phased, evidence-led, and honest about where the real transport sensitivity sits, usually in construction logistics, HGV routing, and the practicalities of low-occupancy but specialist operational travel. They also stay aligned with the rest of the planning package, from access drawings to environmental reporting and travel plan commitments.

    For architects, planners, lawyers, developers, surveyors, councils, and project teams, that is the real goal in 2026: not a generic report, but a transport case that answers likely objections before they become delays. When the assessment is specific, coordinated, and grounded in how the site will actually function, planning decisions tend to become much easier to defend.

    Frequently Asked Questions about Hyperscale and Colocation Data Centre Transport Assessment

    Why is a transport assessment essential for hyperscale and colocation data centre planning applications?

    A transport assessment demonstrates that construction and operational traffic can be safely managed without causing severe impacts on local networks. It informs access strategies, junction design, and mitigation measures, providing evidence to local authorities about HGV routing, congestion, and safety concerns.

    How do transport demands differ between hyperscale and colocation data centres?

    Hyperscale data centres typically involve a single user with large floorspace but low staffing, leading to trip patterns dominated by construction and specialist servicing. Colocation centres have multiple tenants, resulting in more diverse contractor visits, client access, and ongoing fit-out activity with higher operational traffic variability.

    What are the key trip generation factors during the construction and operation of data centres?

    Construction trips include earthworks, bulk material deliveries, and plant fit-out, often peaking with HGV flows. Operational trips mostly involve staff shifts, security, maintenance visits, routine deliveries, and periodic IT refreshes. Each phase requires distinct transport planning and assessment to capture realistic movements.

    How can HGV routing and abnormal load management reduce community impact during data centre construction?

    Clear routing strategies using strategic roads and avoiding sensitive residential areas are critical. Abnormal loads need swept path analysis and timed movements, often off-peak. Delivery management systems with booking, time windows, and on-site holding prevent highway queuing and address local concerns effectively.

    What sustainable travel measures are relevant for data centre transport assessments despite typically low staffing levels?

    Planning expects assessments of walking, cycling, and public transport accessibility, with provisions like secure cycle parking, showers, shuttle services to stations, and travel plans with mode share targets. These measures align with realistic site constraints and support sustainable staff travel options.

    What common pitfalls cause objections to data centre transport assessments, and how can they be avoided?

    Common issues include underestimating construction HGV volumes, unclear vehicle routing, optimistic staff mode share assumptions without controls, and inconsistencies between transport, environmental, and design documents. Avoiding these requires phased, evidence-based assessments aligned with the entire planning submission.

  • Grid-Scale Battery Energy Storage Systems Transport Assessment: What Planning Teams Need To Know In 2026

    Grid-Scale Battery Energy Storage Systems Transport Assessment: What Planning Teams Need To Know In 2026

    Battery storage schemes can look deceptively simple on a red line plan. They are often remote, lightly staffed and operationally quiet, so it is easy for teams to assume transport will be a minor planning issue. In practice, that is rarely the whole story. A grid-scale Battery Energy Storage System (BESS) may generate very few day-to-day trips once commissioned, yet its construction phase can place real pressure on local roads through concentrated HGV activity, abnormal indivisible loads, crane deliveries, and temporary access demands.

    That is exactly why a Grid-Scale Battery Energy Storage Systems Transport Assessment matters in 2026. Planning authorities are increasingly focused on evidence: not broad assurances, but clear forecasts, route testing, visibility checks, collision review, and a Construction Traffic Management Plan that stands up under scrutiny. For architects, planners, solicitors, surveyors, developers and local councils, the transport case often turns less on permanent trip generation and more on whether the temporary impacts have been identified honestly and managed properly.

    In our experience, the strongest submissions do two things well. First, they recognise how BESS sites differ from housing, logistics or employment schemes. Second, they build a proportionate but robust evidence base around construction traffic, access design and routing. The sections below set out what a transport assessment for battery storage usually needs to cover, when it is likely to be required, and how planning teams can avoid the common gaps that lead to delay, objection or awkward requests for further information.

    Key Takeaways

    • A Grid-Scale Battery Energy Storage Systems Transport Assessment focuses chiefly on managing the intense but temporary construction traffic rather than ongoing operational trips.
    • Accurate trip forecasting and route feasibility studies for abnormal loads, such as battery units and transformers, are crucial to avoid delays and objections in planning applications.
    • Early engagement with highway authorities and clear, enforceable Construction Traffic Management Plans (CTMPs) enhance the credibility and acceptability of the transport assessment.
    • Unlike typical developments, BESS sites generate minimal operational traffic but require detailed analysis of peak construction vehicle movements and sensitive routing through rural or constrained areas.
    • Consistent alignment of the transport assessment with environmental and planning documents prevents conflicts and strengthens the overall planning submission.
    • Addressing common concerns like HGV traffic through villages, school-time conflicts, and specialist deliveries upfront improves local authority support and community acceptance.

    What A Transport Assessment For A Grid-Scale Battery Energy Storage System Covers

    Infographic of key steps in a UK battery storage transport assessment.

    A transport assessment for a grid-scale BESS is a planning document that quantifies likely transport effects, tests highway impacts and sets out mitigation. The purpose is straightforward: to show the proposal accords with national and local transport policy, and that any residual effects on safety or network operation are acceptable.

    For battery storage, the scope normally starts with the development description. We need the site location, generating capacity, equipment layout, access points, construction programme, likely phasing and any unusual delivery requirements. Without that baseline, trip forecasting becomes guesswork.

    The next layer is existing transport context: road hierarchy, access constraints, nearby settlements, active travel conditions, baseline traffic flows and local highway character. On constrained rural sites, that context matters more than raw traffic numbers.

    From there, the assessment usually covers:

    • construction traffic forecasts, including staff vehicles, HGVs and peak periods:
    • delivery strategy for batteries, transformers, inverters and cranes:
    • operational and maintenance trips, which are often very low:
    • visibility, access geometry and internal turning:
    • highway safety review, including recent collision data:
    • junction or network capacity testing if traffic uplift warrants it: and
    • mitigation, usually tied together through a CTMP.

    For many projects, the transport chapter also needs to align with the wider planning pack. That may include a broader transport assessment for developments: approach, environmental reporting and construction management documents. The best BESS assessments are not generic templates: they are tightly matched to the construction reality of the specific site.

    When A Battery Storage Development Is Likely To Need A Transport Assessment

    UK infographic showing when battery storage projects need a transport assessment.

    Not every battery storage proposal will need a full transport assessment, but many will need at least a transport statement, and a fair number will justify the fuller document because of construction impacts alone.

    The first trigger is local validation requirements. Some authorities identify thresholds for major development, energy infrastructure or schemes on sensitive rural networks. Others are less prescriptive, so judgement becomes important. If the site is reached via narrow lanes, passes schools or villages, or depends on roads with weak bridges or awkward bends, a TA is far more likely to be expected.

    The second trigger is the profile of construction traffic. BESS developments often have negligible operational trips, but that does not remove the need for assessment. Decision-makers are interested in what happens during the months when civils works, concrete pours, plant deliveries and abnormal loads are using the network. If those flows could materially affect safety, amenity or junction performance, a TA is usually the prudent route.

    A third trigger is consultation risk. Where National Highways, the county highway authority, parish councils or local members are likely to focus on routing and HGV movements, submitting a weak transport case can slow the entire application.

    In practice, we advise planning teams to ask an early question: is transport one of the few technical topics that could create avoidable friction? If yes, a proportionate TA often saves time later. That is especially true where the proposal may also sit within a wider environmental impact assessment framework and transport effects need to be described consistently across documents.

    How BESS Sites Differ From Other Planning Applications In Transport Terms

    Infographic comparing BESS transport risks with standard development traffic in rural UK.

    Battery storage sites do not behave like housing estates, industrial parks or retail schemes. That sounds obvious, but it is a point many reports still underplay.

    The biggest difference is trip profile. A housing scheme creates permanent daily movements. A warehouse may intensify HGV activity year after year. A BESS site, by contrast, is usually remote, secure and largely unmanned once operational. Routine movements often amount to periodic inspections, occasional maintenance vans and infrequent replacement visits. In transport terms, operational traffic is commonly negligible.

    The real issue is concentration. Construction traffic is temporary, but it can be intense. There may be months of earthworks, access formation, trenching, surfacing, fencing and equipment installation, followed by specialist deliveries in narrow windows. That means the TA must pay disproportionate attention to programme sequencing and peak construction days rather than annualised averages that tell nobody very much.

    The other major difference is abnormal loads. Battery containers, transformers, substations and associated plant may travel on low-loaders with escort or notification requirements. That introduces route feasibility questions that do not arise on many standard applications.

    There is also a spatial difference. BESS proposals are often in rural or edge-of-settlement locations close to grid infrastructure rather than established employment areas. The last mile can hence be the problem: single carriageways, weak verges, limited passing opportunity, tight priority junctions and community sensitivity. A good Grid-Scale Battery Energy Storage Systems Transport Assessment reflects that reality instead of assuming low operational trips equal low transport risk.

    Typical Vehicle Movements During Construction, Delivery, Operation, And Maintenance

    Four-phase infographic of BESS site traffic in the United Kingdom.

    For planning purposes, it helps to break BESS traffic into phases rather than treating the development as one static land use.

    During construction, we typically see a mix of staff cars, crew vans, small rigid vehicles and a meaningful proportion of HGVs. Early works may include site clearance, access creation, temporary compounds, drainage and earthworks. Then come foundations, cable trenches, control building works, fencing and surfacing. Depending on scale, concrete wagons, grab lorries, flatbeds and articulated deliveries can all feature.

    Delivery traffic is often the most sensitive element. Battery units, transformers, inverters and switchgear may arrive on specialist trailers. Cranes or lifting plant may also need separate access arrangements. These movements are fewer in number than bulk construction traffic, but each one can carry more planning risk because route constraints become critical.

    Once the site is operational, trip rates fall sharply. Many facilities are unmanned, monitored remotely and visited only for scheduled inspections or reactive maintenance. That can mean a handful of light vehicle trips in a typical week, sometimes less. Occasional HGV activity may occur if major components are replaced, but it is not a daily characteristic of the use.

    Decommissioning should not be ignored, even if it sits years ahead. Authorities increasingly expect an acknowledgment that traffic effects at end of life broadly mirror construction, with removal of equipment and restoration works. The precise detail can remain outline level, but the TA should show the issue has been thought through.

    Construction Traffic Impacts And Access Routing Strategy

    UK infographic showing HGV and abnormal load route checks to a battery site.

    Construction traffic is usually the heart of the assessment. We need to identify not only how many vehicles are likely to travel to and from the site, but where they will go, when they will travel and which parts of the route are genuinely sensitive.

    A sound routing strategy starts with hierarchy. Wherever possible, HGVs should approach from A and B roads, with the shortest practical distance on minor roads. That sounds neat on paper: the challenge is often that grid-connected sites sit beyond the comfortable part of the network. So the strategy has to confront awkward facts early: village centres, school frontages, pinch points, weak bridges, parked cars, steep gradients or substandard junction geometry.

    We normally test peak construction scenarios rather than average days. Authorities want to know the worst credible case, because that is what drives safety and amenity impacts. We also assess whether timing controls are needed to avoid school drop-off periods, commuter peaks or local event days.

    On more sensitive schemes, the routeing narrative should be supported by a plan, driver instructions and contractual obligations through the principal contractor. It is much easier to defend a route when it is enforceable through the CTMP.

    Where the transport effects overlap with wider environmental topics such as noise, dust or settlement amenity, the transport evidence should align with the project’s environmental impact assessment transport: assumptions. Inconsistency between documents is one of those small errors that creates surprisingly large planning headaches.

    Abnormal Loads, Heavy Goods Vehicles, And Route Feasibility Checks

    Abnormal load work is often what separates a routine report from a robust one. If transformers or battery modules require specialist trailers, we need to know whether the route is physically passable and legally workable.

    That usually means a desk-based review followed by route audit where necessary. We look at bridge limits, width restrictions, vertical clearances, tight bends, roundabout geometry, overhanging vegetation, gradients, temporary traffic management and any structures that might be vulnerable. Swept path analysis is then used at the site access and at key junctions where manoeuvrability is doubtful.

    Early engagement with the highway authority matters here. If National Highways is relevant, or if the route crosses authority boundaries, consultation should happen before assumptions harden into application documents. Police notification and route manager coordination may also be needed for abnormal indivisible loads.

    Crucially, route feasibility is not just about whether a vehicle can scrape through. It is about whether it can do so safely, without repeated overrun, unsustainable traffic management or unacceptable disruption to local communities.

    Traffic Surveys, Trip Generation, And Evidence Base Requirements

    A BESS transport assessment still needs evidence, even if the eventual operational trips are tiny. In fact, low day-to-day traffic makes the quality of construction evidence more important, not less.

    Survey requirements depend on site context. For many schemes, automatic traffic counts on access roads and classified turning counts at key junctions will be enough to establish baseline conditions. On more constrained rural routes, we may also need frontage observations, width checks, parking surveys or video review to understand how vehicles actually pass one another in practice.

    Trip generation should be built from the construction programme, not borrowed lazily from unrelated land uses. We typically derive forecasts from likely labour numbers, delivery schedules, earthworks quantities and equipment installation phases, then identify peak day and peak hour scenarios. That matters because a weekly average can hide short periods of very high HGV demand.

    Authorities generally respond well to transparent assumptions. If battery unit deliveries are uncertain at submission stage, say so and test a conservative case. If construction phasing may change, explain the range and identify controls in the CTMP.

    Methodology agreement can also save trouble. A brief scoping discussion with the highway authority often clarifies whether capacity modelling is likely to be needed, which junctions are critical and how survey data should be timed. As with any transport assessment for planning application, the report becomes stronger when the evidence base is proportionate, current and easy to audit.

    Highway Safety, Visibility, And Site Access Design Considerations

    Access design can look like a detail until it becomes the reason for an objection. For BESS developments, the key question is usually whether the access can safely accommodate construction vehicles and occasional specialist loads without creating conflict on the public highway.

    We normally review visibility splays, junction spacing, carriageway width, radii, gradients, drainage and verge condition against the relevant standards, whether that is DMRB, Manual for Streets or a local highway design guide. The correct benchmark depends on context: a rural access onto a faster road is not assessed in quite the same way as a lower-speed urban junction.

    Visibility is often the first pressure point. Vegetation, boundary banks, ditches and level differences can all reduce achievable splays. If improvement works are needed, the TA should be clear about land control and deliverability. Authorities are understandably wary of proposals that rely on visibility over third-party land without certainty.

    Internal design matters too. Gates should be set back far enough to avoid vehicles waiting on the carriageway. Turning space should allow larger vehicles to enter and leave in forward gear. If banksmen or temporary controls are required during specific deliveries, say so explicitly.

    A safety review should also consider collision history on the local network and whether the development could aggravate known issues. That does not mean every recorded collision becomes a reason to refuse. It means the report should show we have looked properly at patterns, context and whether the proposed access or routing strategy introduces additional risk.

    Junction Capacity, Routing Impacts, And Local Network Assessment

    Not every battery storage application needs formal junction modelling. If construction traffic is modest against a robust network, a qualitative assessment may be enough. But where HGV uplift is material, or where the route passes through constrained junctions, capacity and network effects should be tested rather than assumed away.

    The starting point is proportionality. A rural priority junction with low background flow may not require software modelling if the issue is geometry rather than capacity. Conversely, if a site route uses a signal junction, roundabout or strategic road connection already operating near practical capacity, even a temporary increase can matter.

    Beyond capacity, we also consider routing impacts on communities. This is often where local objections gather pace. Village main streets, pedestrian activity near schools, cyclist comfort, amenity and severance all sit slightly outside pure traffic engineering metrics, but they are very much planning considerations. If ten extra HGVs an hour pass through a narrow settlement for a limited period, residents will feel that even if the junction model remains technically acceptable.

    Mitigation hence needs to be realistic. In some cases that means timing restrictions, temporary passing places, localised widening, edge strengthening or marshalling at specific points. In others, it means accepting a longer strategic route because it avoids a sensitive corridor. The strongest assessments do not chase the shortest haul route at all costs: they justify the route that creates the least overall planning harm.

    Construction Traffic Management Plan And Related Planning Documents

    For many BESS schemes, the CTMP is where the transport assessment becomes operational. The TA explains impacts and principles: the CTMP translates them into rules that a contractor can follow and an authority can condition.

    A credible CTMP typically covers:

    • approved construction routes:
    • hours of movement, including any school-time restrictions:
    • HGV booking and delivery management:
    • driver briefings and code of conduct:
    • signage, banksmen and temporary traffic control:
    • wheel washing and road cleanliness measures:
    • on-site parking and turning arrangements:
    • complaint handling and community liaison: and
    • monitoring, review and escalation procedures.

    The level of detail can vary at application stage, especially where a principal contractor is not yet appointed. But the framework still needs teeth. Vague wording such as “vehicles will avoid sensitive times where possible” does not reassure anyone.

    It is also important to align the CTMP with other planning documents. A framework CEMP may deal with dust, noise and construction compounds: the CTMP should mirror its assumptions about programme and working hours. If there is staff travel planning, that should not conflict with site parking arrangements or access controls.

    In our work, this joined-up drafting is often what distinguishes a smooth consultation from a messy one. Highway officers, environmental health teams and case officers do compare notes. If the documents point in different directions, they will spot it quickly.

    Common Planning Risks, Local Authority Concerns, And How To Address Them

    Most objections to BESS transport arrangements are predictable. That is useful, because predictable risks can be dealt with early if the team is honest about them.

    The first recurring concern is HGV traffic through villages. Residents worry about noise, vibration, parked-car conflict and the simple feeling that large vehicles do not belong on local roads. We address that with clear route plans, realistic flow forecasts, timing controls and, where needed, physical mitigation at pinch points.

    The second is school-time conflict. Even a small number of HGVs can become politically and practically problematic if they coincide with drop-off and pick-up periods. A straightforward restriction in the CTMP often carries more weight than paragraphs of reassurance.

    Third, authorities worry about underestimating specialist deliveries. If abnormal loads are treated as an afterthought, confidence in the whole report drops. Better to state early that route testing is needed and either provide it at submission or secure it through a precise condition.

    Another risk is overclaiming the insignificance of impacts because the site will be unmanned in operation. That may be true later, but the application will be judged on construction effects too. We find it is better to acknowledge that temporary impacts can be intense, then show why residual effects are not severe once routing and management are in place.

    And finally, there is document quality. Local authorities are more likely to support concise, technically grounded reporting than generic text that could apply to almost any energy project.

    Preparing A Robust Battery Storage Transport Assessment For Planning Submission

    A robust submission is usually the product of good timing rather than last-minute drafting. By the time the planning application is assembled, the transport strategy should already have informed site layout, access design, construction assumptions and consultant coordination.

    We normally start by scoping the likely transport issues against local policy, validation requirements and route sensitivity. That tells us whether the project needs a full TA, a lighter statement, abnormal load work, junction modelling or simply a stronger CTMP. Early contact with the highway authority can be invaluable, particularly where the route is constrained or crosses multiple jurisdictions.

    The report itself should be clear and conservative. Explain the development in plain language. Use current survey data. Show how trip forecasts were derived. Test peak construction scenarios. Include route plans, visibility information and swept path work where relevant. If assumptions remain provisional, identify the controls that will manage that uncertainty.

    For planning teams, one practical point matters: consistency across the application set. The transport narrative should match the Design and Access Statement, planning statement, construction documents and any environmental reporting. Where projects fall within a broader environmental impact assessment process, discrepancies between chapters can undermine confidence faster than the underlying impacts themselves.

    This is also where experienced reporting helps. On schemes with tight programmes, authorities rarely want volume for its own sake. They want an assessment that is concise, accurate, locally aware and tailored to likely consultation questions. That is exactly the type of planning-focused transport work we aim to deliver.

    Conclusion

    A Grid-Scale Battery Energy Storage Systems Transport Assessment is rarely about proving high operational traffic. More often, it is about demonstrating that a short, intensive construction period can be planned and controlled without creating unacceptable effects on highway safety, capacity or local amenity.

    In 2026, that means planning teams need more than broad statements that a BESS site is “low traffic”. They need evidence: realistic construction trip forecasts, route feasibility for HGVs and abnormal loads, access design that works in practice, and a CTMP with enforceable controls. When those pieces are aligned, battery storage proposals are usually far easier for highway officers and planning authorities to support.

    For developers, architects, lawyers, surveyors and councils, the practical lesson is simple. Treat transport as an early design and consenting issue, not a late technical appendix. If we frame the temporary impacts honestly and manage them properly, the transport case becomes much easier to defend.

    Frequently Asked Questions about Grid-Scale Battery Energy Storage Systems Transport Assessment

    What does a transport assessment for a grid-scale Battery Energy Storage System (BESS) typically include?

    A transport assessment for a grid-scale BESS covers site description, baseline highway conditions, vehicle movement forecasts during construction, delivery, operation, decommissioning, highway safety and access design reviews, junction capacity assessments if needed, and mitigation measures including a Construction Traffic Management Plan (CTMP).

    When is a transport assessment required for a Battery Energy Storage System development?

    A transport assessment is required when local validation guidelines specify thresholds, when construction HGV or abnormal load traffic could impact safety or capacity, or when route sensitivity such as narrow rural roads, village centres, or school zones may lead to concerns during the intensive construction phase.

    How do transport impacts of BESS sites differ from those of housing or industrial developments?

    BESS sites generate very low operational traffic since they are often remote and largely unmanned, but they have temporary, intensive construction traffic dominated by HGVs and abnormal loads. This contrasts with housing or industrial sites that create ongoing daily vehicle movements.

    What are the key considerations for managing abnormal loads in a BESS transport assessment?

    Key considerations include conducting route feasibility checks with swept path analysis and on-site audits, assessing bridge limits, road widths, vertical clearances, tight bends, and gradient challenges. Early consultation with highway authorities and notification to police and route managers ensures safety and compliance.

    How can construction traffic impacts be mitigated during a BESS project?

    Mitigation strategies involve selecting preferred routes prioritising A/B roads, avoiding sensitive areas like schools or villages during peak times, implementing timing controls, enforcing driver instructions via a CTMP, and employing physical measures such as temporary passing places or localised road improvements.

    What role does the Construction Traffic Management Plan (CTMP) play in a BESS transport assessment?

    The CTMP operationalises transport assessment findings by detailing approved routes, movement hours, driver briefings, signage, traffic controls, wheel washing, on-site parking, community liaison and monitoring, ensuring that construction traffic is managed effectively to protect highway safety and local amenity.

  • Life Sciences Laboratories, R&D Campuses And Biotech Facilities Transport Assessment: What Planning Teams Need To Get Right In 2026

    Life Sciences Laboratories, R&D Campuses And Biotech Facilities Transport Assessment: What Planning Teams Need To Get Right In 2026

    A life sciences scheme can look straightforward on a red-line plan and become anything but straightforward once transport is tested properly. A wet-lab building with office-style assumptions applied to it may appear policy-compliant on paper, yet the real-world pattern can be very different: earlier starts, late finishes, shift handovers, controlled deliveries, waste collections, temperature-sensitive logistics, and occasional specialist loads that don’t behave like ordinary B1 traffic at all.

    That is exactly why a Life Sciences Laboratories, R&D Campuses and Biotech Facilities Transport Assessment needs a more tailored approach than a generic employment study. For architects, planners, lawyers, surveyors, developers and local authorities, the key issue is rarely just total trip numbers. It is whether the assessment reflects how the site will actually operate, expand and interact with the surrounding network over time.

    In 2026, that bar is getting higher. Planning authorities are looking harder at sustainable travel credibility, cumulative growth, servicing realism and on-site movement design, particularly where life sciences development sits near sensitive junctions, residential streets, hospitals, universities or constrained urban corridors. From our perspective, the strongest applications are the ones that deal with those operational specifics early, not after an objection lands. This article sets out what planning teams need to get right, where the common weak points sit, and how to build an assessment that stands up under scrutiny.

    Key Takeaways

    • A tailored Life Sciences Laboratories, R&D Campuses and Biotech Facilities Transport Assessment must reflect actual site operations, including shift patterns, specialist deliveries, and phased campus growth, rather than relying on generic employment assumptions.
    • Robust transport assessments provide evidence on how staff, visitors, goods, and vehicles safely and efficiently access the site, addressing local highway capacity, sustainable travel options, and servicing realism to meet stricter 2026 planning policies.
    • Accounting for diverse travel behaviours, such as early starts and late finishes, is essential for accurate trip generation models, which should be built from operational data and comparable site evidence rather than standard office benchmarks.
    • Comprehensive servicing and waste management plans are critical, specifying vehicle types, delivery timings, and manoeuvring space to ensure reliable scientific operations and avoid disruptions.
    • Parking, access, and on-site movement plans must consider allocation and control for varied user groups and emergency scenarios to prevent conflicts and overspill into residential areas.
    • Early engagement with planning authorities and using data-driven, scenario-tested transport strategies enhances the credibility and resilience of life sciences transport assessments, reducing objection risks and supporting sustainable travel measures.

    Why Transport Assessments Matter For Life Sciences And Biotech Development

    Infographic of biotech campus transport assessment factors in the United Kingdom.

    Life sciences and biotech schemes are rarely judged purely as buildings. They are assessed as operating environments, often with demanding technical, regulatory and servicing requirements. A transport assessment matters because it shows whether people, goods and vehicles can reach the site safely, efficiently and in a way that aligns with planning policy.

    For this sector, the stakes are higher than with a standard office development. Staffing can include researchers, lab technicians, facilities engineers, GMP manufacturing teams, contractors, clinical staff and specialist visitors. Their travel behaviour may stretch beyond the classic 8:30 to 9:00 commuter peak. Add courier activity, cold-chain logistics, gas deliveries, hazardous waste movements and emergency access requirements, and a generic desktop exercise quickly starts to look thin.

    A robust assessment also helps planning teams answer the questions authorities are increasingly asking in 2026: can the local highway network absorb growth: is public transport realistically usable for shift-based staff: will walking and cycling measures genuinely work: and how will future phases affect parking, servicing and junction operation? Those issues often connect with wider reports too, including a broader transport assessment for major development and, where relevant, an environmental impact assessment.

    Put simply, the document is not a formality. It is the evidence base that can either reassure decision-makers or expose unrealistic assumptions.

    How These Facilities Create Distinct Travel And Servicing Demands

    Infographic of a UK biotech campus showing travel, servicing, and phased expansion.

    What makes a life sciences transport assessment different is not one single trip type. It is the mix. These developments often blend research, write-up space, administration, pilot production, storage, plant, amenity areas and highly controlled environments on one site. Each component generates a different pattern, and planning teams need to model that pattern as an operational whole rather than as a broad employment average.

    A city-edge biotech facility near a rail station may support a strong non-car mode share for researchers, but still rely on tightly managed van activity for samples, reagents and temperature-controlled consumables. A campus outside a town may need shuttles, phased parking controls and carefully timed servicing windows to avoid defaulting back to private car dependence. In both cases, the answer lies in understanding the occupier profile and operating model, not in lifting rates from an office benchmark.

    That is why the best evidence tends to combine survey data, operator input, comparable site observations and policy context. We have found that local authorities respond far better when the narrative explains why a facility will travel differently, rather than simply presenting tables of trips without operational reasoning.

    Laboratories, Cleanrooms And Research Spaces

    Laboratories and cleanrooms bring servicing requirements that can be easy to underestimate. Wet labs may need routine chemical deliveries, specialist gases, controlled storage arrangements and segregated waste collections. Cleanroom operations may also impose stricter separation between staff entrances, secure deliveries and waste exits, which has direct implications for access design and yard management.

    The transport consequences are practical, not theoretical. Can delivery vehicles reach the correct point without crossing pedestrian desire lines? Is there enough space for secure unloading, short-term holding and reversing-free movement? Can emergency access be maintained when service vehicles are on site? These questions matter because scientific operations often depend on reliability. A missed or delayed delivery is not just inconvenient: it can disrupt testing windows, research programmes or production batches.

    There is also a tendency to underplay the support functions around research space. Plant maintenance teams, calibration specialists, compliance auditors and equipment engineers can produce a steady stream of non-routine visits. On higher-specification sites, those visitors do not behave like ordinary office guests. The transport assessment should say so clearly.

    Multi-Building Innovation Campuses And Phased Expansion

    Many life sciences schemes now come forward as campuses rather than single buildings. That means multiple plots, shared access roads, centralised parking, internal shuttle movement, phased utilities and overlapping construction periods. A transport assessment that only tests the first building can quickly become obsolete.

    Phasing is especially important where early buildings rely on temporary parking, interim servicing yards or construction access that later phases will displace. Authorities will want to know how the site works at each stage, not just at final completion. That includes cumulative trip growth, changing peak patterns, temporary pedestrian routes and the impact of occupied phases sitting beside active construction.

    Innovation campuses also tend to attract varied occupiers over time. A building initially marketed for R&D may later accommodate a blend of lab, office and light production. So flexibility needs to be built into the assessment. A sensible strategy is to test realistic parameter scenarios and define management controls in a way that remains usable if occupier details evolve. In larger cases, a Development Transport Assessment: framework supported by staged monitoring is often more defensible than a single fixed forecast.

    When A Transport Assessment Is Likely To Be Required

    Decision-tree infographic showing when a UK biotech transport assessment is needed.

    A formal transport assessment is likely to be required where a life sciences or biotech proposal is major in scale, materially intensifies an existing site, or sits on a constrained network. In practice, that can include a new research building, expansion of an established science park, conversion of commercial floorspace into labs, or a phased campus with mixed R&D, office and production elements.

    Thresholds vary by local authority, so there is no single national trigger that covers every case neatly. But the need becomes more likely where the proposal would generate noticeable staff, visitor or servicing traffic: where access sits close to sensitive junctions, schools, hospitals or residential streets: where parking demand is likely to be contentious: or where public transport accessibility is limited compared with policy expectations.

    Authorities also tend to expect transport evidence where the scheme could have cumulative effects with nearby development. That point is particularly relevant in science clusters around university districts, hospital campuses and strategic employment zones, where several medium-sized applications can collectively affect the same network.

    The sensible move is to scope early. A brief discussion with highways officers can establish whether a transport statement is enough or whether a full assessment, travel plan, delivery and servicing plan, construction traffic management plan, or junction modelling will be needed. On more technical schemes, working with experienced Transport Assessment Consultants: early can prevent a lot of expensive redesign later.

    Key Trip Generation Factors For Labs, R&D And Biotech Sites

    Infographic showing lab site travel demand, shift patterns, and servicing flows.

    Trip generation for this sector should be built from the operation outward. Gross internal area still matters, of course, but floor area alone is a weak predictor where a building contains very different functions. A 10,000 sq m site with mostly write-up and office accommodation behaves very differently from one with high-intensity labs, GMP suites, specialist storage and a heavy technical support presence.

    The core variables usually include floorspace by use: staffing numbers by role and shift: visitor categories: contractor activity: public transport accessibility: car parking restraint: and the intensity of servicing. Clinical trial activity, training events or collaboration space can add intermittent peaks that will not appear in a simplistic daily average.

    Data quality is where many assessments either gain authority or lose it. Comparable benchmarks should be relevant to modern lab and R&D uses, not generic business park rates from another era. Where an existing occupier, nearby facility or portfolio asset can provide observed information, it is usually worth incorporating. The same goes for parking beat surveys, staff postcode analysis and timetable checks for shift compatibility.

    The goal is not to inflate numbers for safety. It is to present a believable picture. Decision-makers can usually tell when trip generation has been derived from assumptions that do not match the way a science building actually works.

    Staffing Profiles, Shift Patterns And Peak Travel Behaviour

    Life sciences development often breaks the standard commuter template. Researchers may work long experimental windows. GMP or pilot manufacturing staff may operate shifts. Facilities and maintenance teams can arrive early. Security, cleaning and support staff may overlap with technical staff at handover times. The result is a travel profile with broader shoulders and, sometimes, peaks outside the traditional network high points.

    That matters for both highways and sustainable travel analysis. A station that looks well connected at 8:30 may offer much poorer practical options for a 6:00 start or a 22:00 finish. Likewise, a junction impact assessment focused only on classic AM and PM peaks may miss concentrated traffic around shift changeovers.

    For that reason, we generally prefer explicit shift modelling where operations suggest it. Staff numbers should be broken down by role and by likely arrival/departure band, with assumptions tested against operator evidence. On larger sites, sensitivity testing can be useful too: what happens if manufacturing expands faster than office-based functions, or if contractor activity rises during commissioning? The answers often shape parking, shuttle provision and highway mitigation more than headline daily trip totals.

    Deliveries, Specialist Equipment, Waste Streams And Servicing Activity

    Servicing is one of the most underestimated parts of a Life Sciences Laboratories, R&D Campuses and Biotech Facilities Transport Assessment. These sites can generate a regular flow of courier vans, temperature-controlled deliveries, specialist consumables, gas cylinder movements and regulated waste collections. Some also require occasional deliveries of large plant, lab fit-out modules or abnormal loads.

    The planning issue is not just volume. It is control. Hazardous, biological or chemical waste streams may need licensed carriers, fixed collection procedures and defined vehicle routes. Inbound and outbound flows may need to avoid conflict with staff arrivals, clinical visitors or sensitive internal areas. And if there is no adequate turning space, a relatively low number of service trips can still create a serious operational problem.

    A credible assessment should hence quantify servicing as far as possible, identify vehicle types, explain timing assumptions and set out how loading, waiting and circulation will be managed. Where abnormal loads are possible, swept paths and route checks may be needed. If junction performance is sensitive, tools such as Junctions 11 Software can help demonstrate whether access arrangements remain robust under realistic service and staff scenarios.

    Parking, Access And On-Site Movement Considerations

    Infographic of parking, access, and vehicle movement on a UK biotech campus.

    Parking on life sciences and biotech sites is rarely a simple numbers exercise. Quantity matters, but so does allocation, control and layout. Different user groups often need to be separated: staff, visitors, blue badge users, service vehicles, emergency access, clinical attendees, car-share spaces and electric vehicle charging. On larger campuses, there may also be tension between early-phase temporary parking and the final movement strategy.

    A common planning mistake is to apply a single parking ratio and stop there. In reality, operational resilience depends on who parks where, when and under what controls. Shift-based staff may need access at times when public transport is sparse. Visitors may need highly legible short-stay parking close to reception. Service vehicles may require secure yards and waiting space that cannot be informally absorbed into general parking. If overspill risk exists, nearby residential streets will become a material planning concern very quickly.

    Access design deserves the same level of attention. Can articulated vehicles enter and leave in forward gear where needed? Is there enough stacking space to prevent vehicles waiting on the highway? Are pedestrian routes protected from loading manoeuvres? Can waste and service areas operate without crossing clean or secure zones? These are often decisive details for officers and consultees.

    On-site movement should also reflect emergency and incident scenarios. A layout that works on a normal day but fails when a delivery overruns, a gate is controlled, or a contractor van blocks a turning area is not really a robust layout.

    Sustainable Transport, Travel Planning And Mode Shift Expectations

    In 2026, policy expectations around mode shift are not getting lighter. For life sciences development, the challenge is to show that sustainable travel measures are both ambitious and believable. Authorities are increasingly sceptical of travel plans that promise reduced car use without accounting for shift work, specialist staff catchments or constrained public transport at non-standard hours.

    The strongest approach usually starts with honest baseline analysis: where staff are likely to come from, what public transport actually offers across the operating day, and how safe walking and cycling routes really are. From there, measures can be targeted rather than generic. That may include station shuttles, secure cycle parking, showers and lockers, guaranteed ride-home measures, car-share management, phased parking restraint, season ticket support or collaboration with local operators on timetable improvements.

    For campus sites, internal walkability matters too. A rail-connected site still underperforms if people have to cross vehicle-heavy service roads or navigate unclear routes between buildings. Likewise, cycle parking tucked behind plant enclosures tends not to drive meaningful uptake.

    Travel plans should also be monitored and adaptable. Occupiers change, buildings phase in, and staffing profiles shift. We often find that a site-specific plan linked to occupation triggers is more credible than boilerplate wording. Broader guidance on Development Transport Assessment: A planning strategy can help frame that, even where the final measures must be tailored to a science-based occupier profile.

    One caution: reduced parking can support policy compliance, but only if it is matched by realistic alternatives. Otherwise the pressure simply moves off-site.

    Common Planning Risks And How To Strengthen An Application

    The most common risk is using the wrong comparator. If trip rates are borrowed from ordinary office or industrial uses without explaining the science-specific operation, the whole assessment becomes vulnerable. Authorities, neighbours and highway consultees will quickly challenge figures that ignore shifts, specialist servicing or phased campus growth.

    Another frequent weakness is under-specifying servicing. We still see applications that describe deliveries in broad terms without identifying waste collections, gas movements, courier frequency, abnormal loads or secure unloading arrangements. On a lab-led scheme, that omission can be enough to trigger requests for more information or conditions that are far more restrictive than they needed to be.
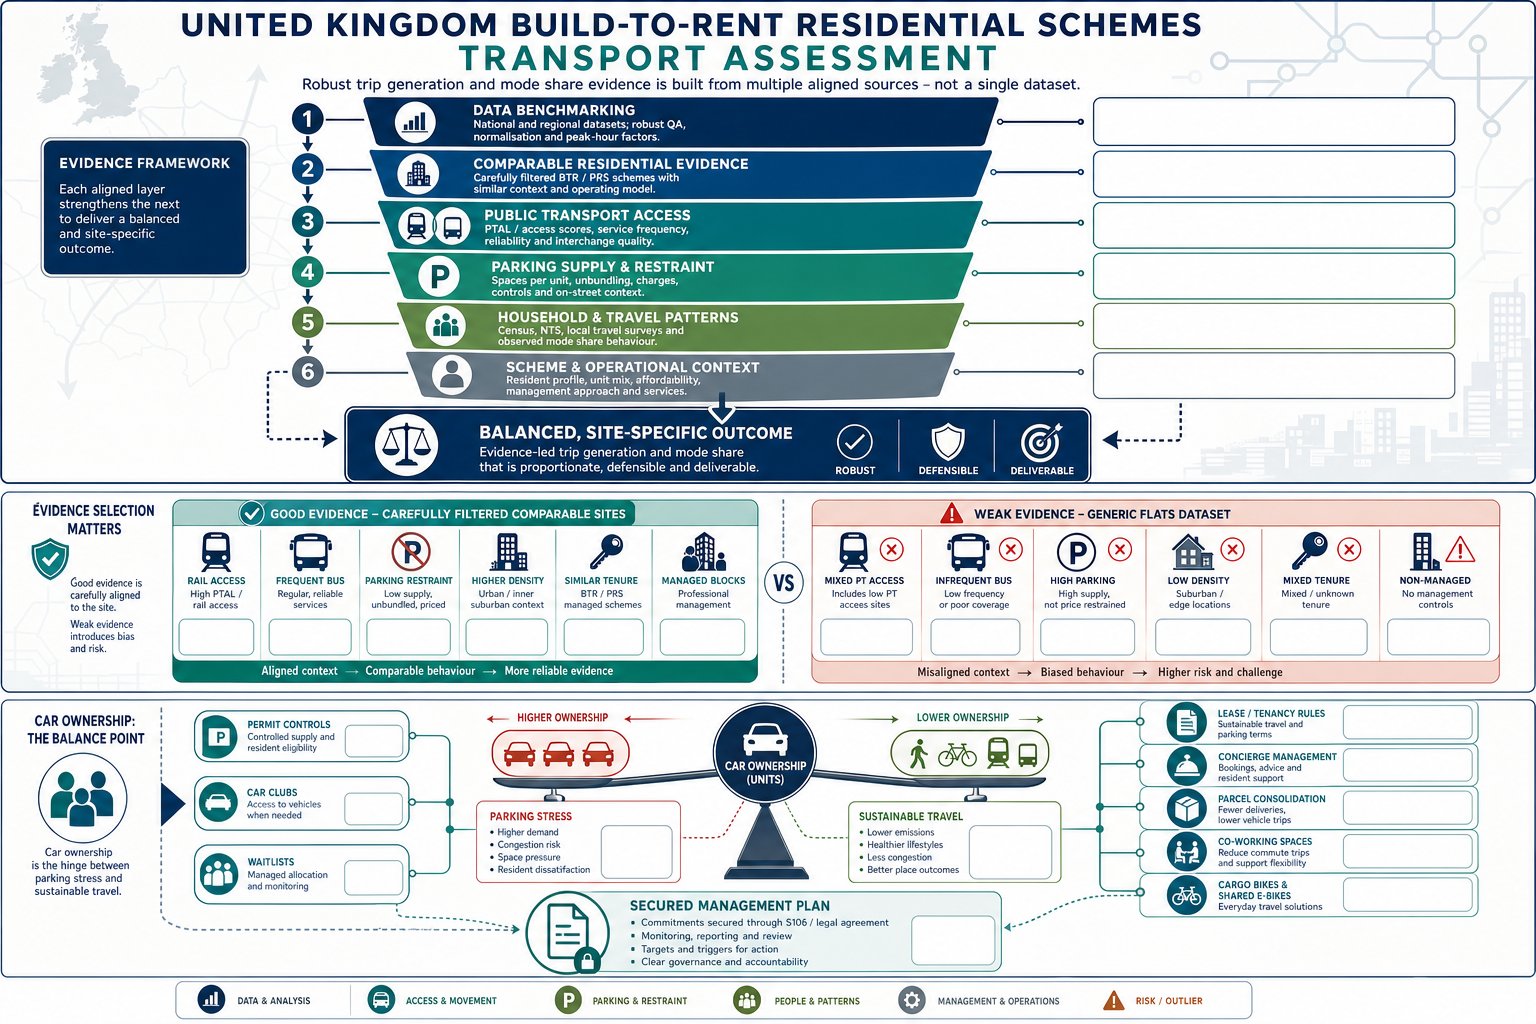
    Parking is another pressure point. Too little evidence on staff catchments, shift compatibility with public transport and overspill risk can make a restrained parking strategy look aspirational rather than workable. Too much parking, on the other hand, can undermine policy alignment and weaken mode shift claims. The answer is usually a staged, managed strategy rather than a blunt maximum or minimum.

    To strengthen an application, we should scope with the authority early, use tailored benchmarks, explain operational assumptions in plain English and test realistic scenarios for both occupation and servicing. If the scheme forms part of a broader portfolio, experience from other sectors can help sharpen method, even where the land use differs: a well-structured Residential Development Transport study, for example, still teaches useful lessons about parking evidence, phasing and local sensitivity. And where planning teams need concise, authority-aware reporting, practice built around local thresholds and quick turnaround can make a real difference.

    Conclusion

    A strong Life Sciences Laboratories, R&D Campuses and Biotech Facilities Transport Assessment is not built from generic employment assumptions. It is built from the realities of how scientific sites operate: specialist staffing, shift patterns, regulated servicing, secure access, future phasing and credible sustainable travel measures.

    For planning teams, getting this right in 2026 means moving early, scoping properly and treating transport as part of operational design rather than a late-stage planning attachment. The applications that perform best are usually the ones that explain the site clearly, test realistic scenarios and show how people, goods and vehicles will move safely from day one through to future expansion.

    Where that evidence is tailored, proportionate and locally grounded, it does more than satisfy a validation requirement. It reduces objection risk, strengthens negotiations and gives decision-makers confidence that the development can function in the real world, not just in a spreadsheet.

    Life Sciences and Biotech Transport Assessment FAQs

    Why is a tailored transport assessment crucial for life sciences laboratories and biotech facilities?

    A tailored transport assessment reflects the specialised travel and servicing patterns of life sciences sites, including shift work, regulated deliveries, hazardous waste handling, and phased campus expansion, ensuring safe and efficient access beyond generic office assumptions.

    When is a transport assessment typically required for life sciences developments?

    A transport assessment is generally required for large-scale projects, significant site intensifications, developments near sensitive receptors, or constrained networks. Early scoping with authorities helps determine if a full assessment, travel plan, or servicing plan is needed.

    How do shift patterns at life sciences campuses affect transport planning?

    Staff shifts often extend beyond typical office hours with multiple changeovers creating travel peaks outside normal commuter times. Assessments must model these to accurately predict traffic and sustainable travel needs, including public transport at non-standard hours.

    What are the key servicing considerations for life sciences labs and cleanrooms?

    These facilities require frequent deliveries of chemicals, gases, temperature-controlled supplies, and secure waste collections. Transport plans must ensure safe access, segregation of vehicle routes, sufficient unloading space, and emergency access to accommodate specialist servicing safely.

    How can sustainable transport measures be effectively incorporated at life sciences R&D campuses?

    Effective measures include targeted shuttle services, secure cycle parking, car-share schemes, and travel plans that consider shift patterns and site-specific public transport availability. Mode shift ambitions must be credible and supported by onsite walkability and practical alternatives to car use.

    What common mistakes weaken life sciences transport assessments, and how can they be avoided?

    Common errors include using generic trip rates ignoring specialised operations, underestimating servicing demands, and simplistic parking strategies. Strengthening assessments involves using tailored data, explicit shift and servicing modelling, robust travel plans, and early liaison with transport assessment consultants.

  • Sports Grounds Transport Assessment: What Planners, Developers, And Councils Need To Know In 2026

    Sports Grounds Transport Assessment: What Planners, Developers, And Councils Need To Know In 2026

    A sports ground can look straightforward on a site plan: a pitch, a stand, some parking, maybe an indoor hall and a café. In planning terms, though, it rarely behaves like a standard development. Traffic arrives in waves. Pedestrians appear in large numbers within short windows. A quiet weekday training session can sit alongside a Saturday sell-out fixture, a school tournament, or an evening community event. That mismatch between ordinary use and event-day intensity is exactly why a Sports Grounds Transport Assessment matters.

    In 2026, local planning authorities and highway authorities are expecting more than a basic note on parking numbers. They want evidence. They want clear scenarios. And they want confidence that residual transport impacts will be acceptable not only on an average day, but under realistic peak conditions.

    For architects, planning consultants, developers, solicitors, surveyors and councils, the challenge is usually not whether transport should be considered. It is how to present a robust, proportionate case that reflects the real operating pattern of the venue. We find that the strongest assessments combine technical analysis with operational realism: who arrives when, by what mode, through which gates, and what happens when the final whistle goes.

    This guide sets out what a sports grounds transport assessment should cover, when it is likely to be required, and how to prepare one that stands up in the planning process.

    Key Takeaways

    • A Sports Grounds Transport Assessment is essential to manage transport impacts for sports venues by addressing both typical use and event-day peaks.
    • The assessment must be based on robust attendance-led trip generation data and consider multiple scenarios such as match days, training sessions, and multi-use events.
    • Access design and highway impact evaluations should reflect realistic crowd movements, including safe pedestrian routes and effective vehicle circulation during peak times.
    • Parking demand analysis must be detailed and supported by evidence, incorporating management strategies to prevent neighbourhood overspill and ensure safety.
    • Sustainable transport modes like walking, cycling, and public transport are critical and should be realistically appraised and enhanced to reduce private car dependency.
    • Early and integrated planning with local authorities, clear scenario testing, and operational detail ensures a credible assessment that supports planning approval decisions.

    What A Sports Grounds Transport Assessment Covers

    Infographic of a sports venue transport assessment covering access, travel, parking and events.

    A sports grounds transport assessment is a planning document that identifies, quantifies and manages the transport effects of a stadium, sports centre, playing fields complex or similar venue. In practical terms, it explains how people, vehicles and servicing activity will get to and from the site under normal operation and event conditions.

    The scope usually starts with the development description: pitches, spectator seating, indoor facilities, hospitality areas, clubhouses, gyms, changing rooms, floodlit training areas and ancillary uses. That matters because each element generates different travel patterns. A community pitch block behaves differently from a semi-professional ground with turnstiles and coach arrivals.

    From there, the assessment normally covers trip generation, mode share, access design, highway impact, parking demand, public transport accessibility, walking and cycling conditions, crowd movement and mitigation. For many schemes, it sits alongside a wider transport assessment for planning strategy, but sports venues need a more event-led lens than most development types.

    A good TA also distinguishes between day-to-day operation and special event conditions. That distinction is often where weaker submissions fall short. If the document only describes a “typical day”, it may tell the authority very little about the periods they actually care about: pre-match arrivals, post-match dispersal, concurrent pitch use, school drop-off overlap, or an evening event in poor weather when walking and cycling mode share falls.

    The aim is simple enough: provide a transparent evidence base so decision-makers can judge whether access is suitable, impacts are acceptable, and mitigation is properly secured.

    When A Transport Assessment Is Needed For Sports Ground Planning Applications

    Decision infographic showing when a UK sports ground transport assessment is needed.

    Not every sports proposal needs a full transport assessment, but many do. The trigger is usually material transport impact rather than land use label alone. If a proposal is likely to create significant attendance, alter access arrangements, affect junction operation, increase on-street parking pressure, or generate event peaks at sensitive times, a TA is commonly expected.

    In the UK planning context, local validation requirements, local plan policies and standing advice from the highway authority often shape the threshold. A modest training facility with limited spectator use may only need a concise transport statement. A new stand, expanded clubhouse, floodlit all-weather pitches, or a ground intended to host larger fixtures may require much more. So may schemes that introduce a new vehicular access, rely on temporary traffic management, or sit within constrained urban streets.

    Timing is critical. We usually advise agreeing scope early through pre-application discussion, especially where match-day patterns differ sharply from weekday use. This is where wider end to end transport thinking helps: planning, operations, safety and highways need to align from the outset, not after a design has hardened.

    Authorities are particularly likely to ask for a TA where events overlap with network peak periods, where local residents may experience parking overspill, or where walking routes have limited width or crossing opportunities. Even if trip totals look manageable on paper, the concentration of movements in 30- to 60-minute windows can justify assessment.

    The practical test is this: could the development create transport effects that a planning officer or highway authority cannot comfortably infer without evidence? If yes, a sports grounds transport assessment is usually the prudent route.

    How Sports Grounds Differ From Standard Development Sites

    Infographic showing sports ground transport peaks, travel modes, and overlapping event impacts.

    Sports grounds are unusual because they are not governed by one stable peak profile. A housing scheme, office building or industrial unit tends to produce comparatively predictable daily rhythms. A sports venue often does not. Demand is highly peaked, operationally sensitive and heavily influenced by fixture type, season, weather, kick-off time and the success of the home team. Anyone who has seen a quiet ground turn into a crowded local hotspot within 45 minutes will understand the point.

    That means person-trip density can be very high for short periods. It also means mode split may differ sharply from conventional assumptions. Some venues attract a larger share of walking trips from nearby neighbourhoods. Others depend on rail, shuttle buses or organised coaches. Some school and community sites have intense but short evening peaks with a strong parent drop-off element.

    Multi-use operation complicates matters further. A single site may host league matches, weekday training, children’s tournaments, community hire, hospitality events and non-sport functions. Those overlapping uses can create cumulative pressure on access roads and parking areas that would be missed in a generic assessment.

    The analytical tools are often familiar, but the framing is not. We may still use a traffic impact assessment and junction modelling, yet the assumptions must reflect crowd behaviour and event operations rather than ordinary commuter patterns.

    In short, sports grounds demand a more scenario-based, operationally grounded approach. The planning question is rarely “what happens on a normal Tuesday?” It is “what happens when the venue is doing what it was built to do?”

    Key Trip Generation And Attendance Considerations

    Infographic showing sports ground attendance scenarios, trip types, and match-day transport patterns.

    Trip generation is at the heart of any sports grounds transport assessment, but it should never be reduced to a single trip rate multiplied by floor area. For sports venues, attendance-led analysis is usually more credible. We need to understand who uses the site, in what numbers, at what times, and by which modes.

    Typical inputs include historic attendance data, ticketing records, club forecasts, comparable sites, census travel patterns, local parking constraints, public transport availability and observed surveys where available. The assessment should separate players, staff, spectators, officials, volunteers, servicing traffic and coach movements. That matters because their arrival and departure profiles are different.
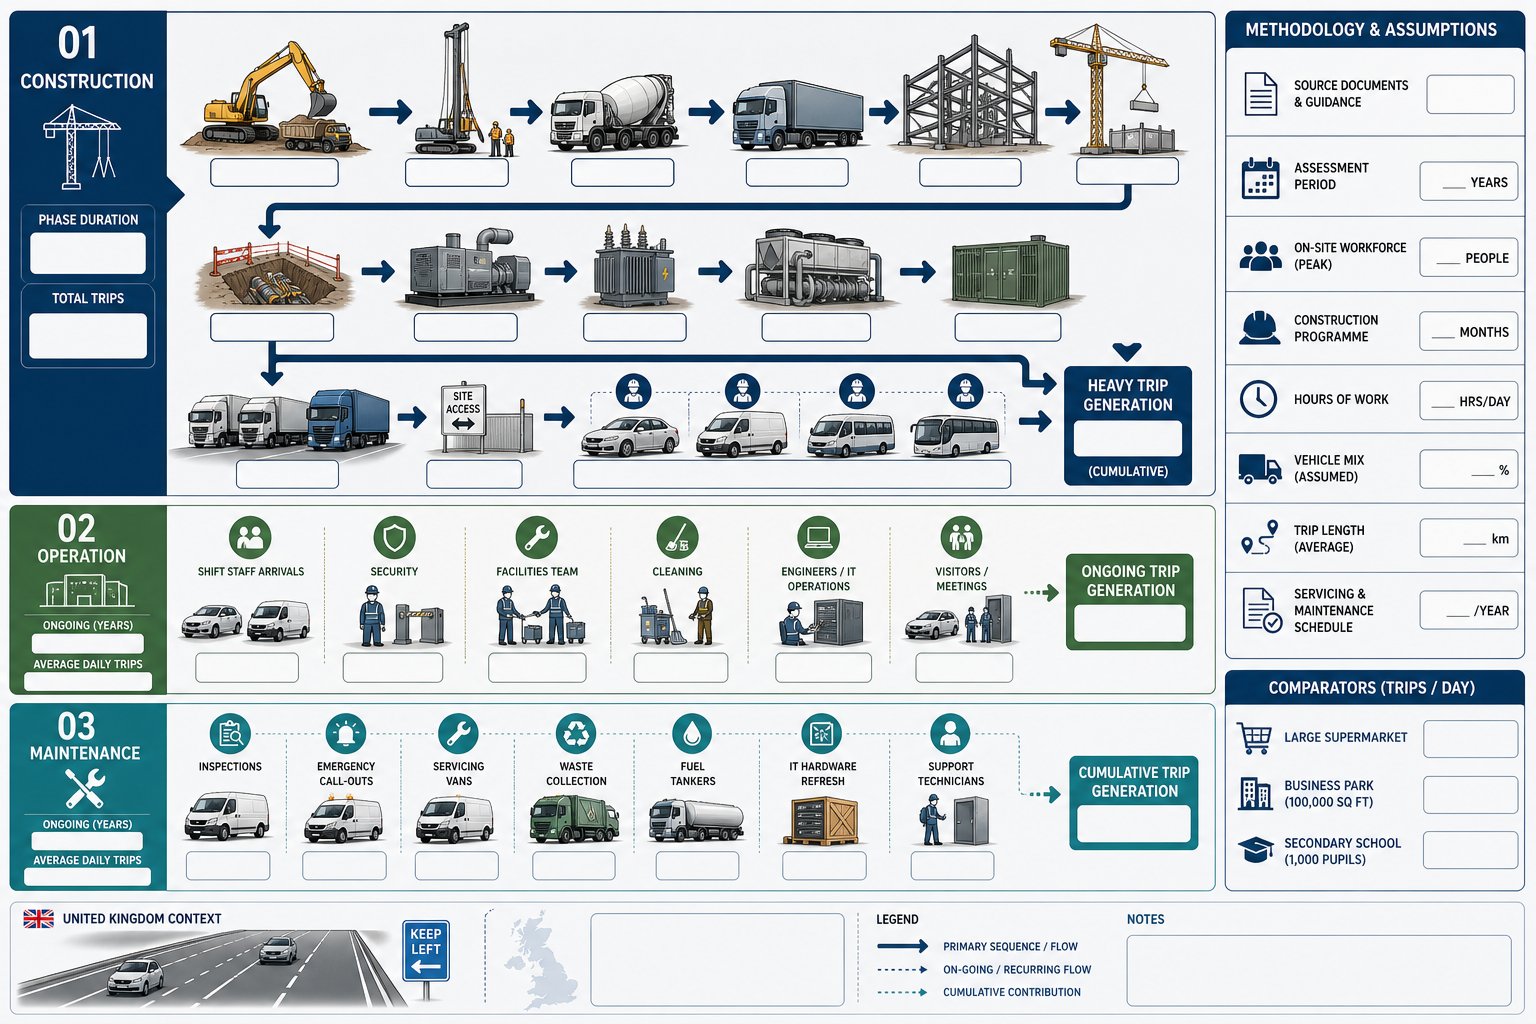
    For many applications, it is helpful to define attendance bands such as baseline use, small event, medium event and worst-case event. Each scenario can then be tested with a corresponding mode split and parking demand assumption. This is usually more transparent than presenting one blended figure that hides the important variations.

    We also need to distinguish person trips from vehicle trips. A crowd of 1,500 does not equal 1,500 cars, obviously, but neither can we assume ideal car occupancy or perfect public transport uptake. Robust analysis sits in the middle: evidence-led, locally grounded and clear about uncertainty.

    Where assumptions are likely to be scrutinised, a wider Development Transport Assessment: A style methodology can help structure the narrative, but the numbers still need to reflect sports-specific operation.

    Match Days, Peak Periods, And Event Scenario Testing

    Match-day assessment should focus on concentration, not just volume. Two hundred cars spread over three hours may be manageable: the same number arriving in 25 minutes before kick-off is another matter. That is why scenario testing should examine pre-event arrival, post-event egress and any overlap with weekday highway peaks.

    Common scenarios include a sell-out fixture, evening kick-off, poor weather reducing active travel, and concurrent use of adjacent facilities. For larger venues, we may also test delayed dispersal, phased exits, or a policing plan that temporarily holds supporters back. The point is not to invent dramatic edge cases. It is to capture realistic conditions that the authority would reasonably expect the site to handle.

    Seasonal Variation, Training Use, And Multi-Use Activity

    Seasonality can materially change the transport picture. League fixtures, cup ties, school terms and summer tournaments all affect travel demand. A ground may be quiet off-season but busy during a concentrated fixture list. Floodlit training can generate regular weekday evening trips even where spectator demand is minimal.

    Multi-use sites need special care. A sports hall, fitness suite, café or community room can create a second layer of demand that overlaps with formal sport. We should hence assess not only headline events but the site’s operating calendar as a whole. That is often where cumulative impacts emerge.

    Access, Highway Impact, And Junction Capacity Assessment

    Infographic of sports ground access, junction capacity, and crowd movement assessment.

    Access assessment begins with geometry and function. Can vehicles enter and leave safely? Are pedestrian and cycle routes legible and protected? Is there enough space for queueing, turning and gate control without traffic spilling back into the highway? For sports venues, those questions are operational as much as physical.

    The highway impact side then considers how nearby links and junctions perform with development traffic added. The study area should reflect the routes people are actually likely to use, not just the easiest roads to model. Key junctions often include the site access itself, nearby signal junctions, mini-roundabouts, residential pinch points and approaches to strategic roads or stations.

    Capacity testing may involve priority junction assessment, signal modelling or network tools depending on site context. Where relevant, practitioners often use Junctions 11 Software or equivalent packages, but software output is only as good as the scenarios and inputs behind it. For sports grounds, queueing and recovery times after events can be as important as ratio or delay metrics.

    Road safety should also be addressed. That can include visibility splays, collision record review, crossing desire lines, temporary traffic control and conflict between pedestrians and cars close to the venue. A technically compliant access can still perform poorly if hundreds of people spill across it after a final whistle.

    The most persuasive assessments connect layout, operations and modelling. They show not only that a junction works numerically, but why the access strategy is realistic under live event conditions.

    Parking, Drop-Off, Coaches, And Servicing Requirements

    Parking arguments can become the make-or-break issue on sports schemes, particularly where nearby residential streets are sensitive. A robust sports grounds transport assessment should hence quantify parking demand by scenario, explain the assumptions behind it, and show how demand will be managed rather than merely absorbed.

    Car parking provision should account for spectators, players, staff, officials and accessible users. But that is only part of the picture. Many venues also need dedicated coach spaces, team minibuses, taxi or ride-hail pick-up areas, parent drop-off loops, and on-site servicing that does not conflict with pedestrian peaks. If those functions are pushed into the public highway, objection risk rises quickly.

    The design matters as much as the headline number. Poorly arranged car parks can cause internal congestion, block coaches, or create unsafe reversing close to crowds. We often find that a carefully managed lower-parking strategy works better than a nominally generous layout with weak circulation and no stewarding plan.

    Evidence should include parking beat surveys, local restrictions, match-day controls and likely displacement risk. Where overspill is a concern, mitigation may involve permit protection, event-day management, pre-booked parking, shuttle links or staggered egress. In more constrained cases, parking strategy may sit within a broader Private Sector Transport Planning framework that balances operations, neighbour impacts and planning policy.

    Servicing is sometimes overlooked. Deliveries, refuse collection, catering vehicles and broadcast units all need space and routing clarity. If they cannot be accommodated on site, the authority will usually notice.

    Walking, Cycling, And Public Transport Accessibility

    For many sports venues, sustainable access is not a box-ticking exercise: it is the reason the scheme can function acceptably at all. If a ground relies too heavily on private car use, peak arrival and departure flows can overwhelm local streets even where the absolute crowd size is modest.

    A proper assessment should map pedestrian catchments, likely desire lines and route quality. That means footway widths, lighting, gradients, crossings, step-free access, personal security and capacity at obvious pinch points. Post-match egress is often the stress test. A route that feels adequate for scattered daytime movement may struggle when large crowds leave at once.

    Cycling analysis should cover route connectivity, road conditions, secure parking and realistic demand. Overpromising cycle mode share without safe routes is an easy way to lose credibility. Equally, underestimating demand can leave facilities full and informal parking scattered around entrances.

    Public transport review should consider distance to rail and bus services, frequency, timing, spare capacity and the practical walk from stop to gate. For larger schemes, authorities may expect more explicit multi-modal accessibility analysis and discussions with operators.

    Where a site forms part of an environmental impact assessment process, sustainable mode evidence often has wider importance because it feeds air quality, carbon and placemaking arguments as well as traffic impact.

    The key is realism. We should show how people are likely to travel, and what improvements are needed to support a better mode split over time.

    Crowd Management, Safety, And Operational Movement Planning

    A sports grounds transport assessment cannot stop at traffic numbers. It has to reflect how crowds actually move. That means ingress and egress planning, gate operation, queue storage, stewarding arrangements, segregation where required, emergency access and the relationship between the venue boundary and the public highway.

    This is one area where planning and licensing-style operational thinking overlap. The transport document does not need to become a full safety certificate submission, but it should show that access arrangements are consistent with the venue’s operational strategy. If spectators queue onto a live carriageway, or if coach arrivals cut across principal pedestrian routes, the issue is not just inconvenience: it is risk.

    Good assessments show where people wait, where they cross, how they disperse and what temporary measures apply on larger event days. That can include barriers, marshals, cones, road closures, signed walking routes, contraflow systems and emergency vehicle protocols. The more complex the site, the more important a plan-led approach becomes.

    In practice, councils and applicants benefit from bringing transport and operations together early. Experienced Transport Assessment Consultants: will usually spot movement conflicts before they become formal objections.

    There is also a reputational point here. A ground that feels orderly and safe to approach is more likely to maintain community support than one that repeatedly creates local confusion after every big fixture.

    Travel Plans, Mitigation Measures, And Planning Conditions

    Mitigation is where the assessment becomes a decision-making tool rather than a descriptive report. If the TA identifies pressure on junctions, parking, crossings or public transport access, it should set out practical measures that reduce those impacts to an acceptable level.

    Travel plans are often central to that package. For sports grounds, these may include event-day travel information, ticket-based travel messaging, shuttle buses, cycle parking delivery, staff travel measures, coach management, car share initiatives and coordination with public transport operators. Done well, the travel plan is not fluffy policy language. It is an operational document with actions, responsibilities, monitoring and review points.

    Physical mitigation may involve new crossings, widened footways, access redesign, signage, dropped kerbs, junction works, temporary traffic management or parking controls. The right package depends on local context. Some sites need infrastructure. Others need tighter event management and enforceable caps on attendance or frequency.

    Planning conditions and legal agreements often secure these measures. Typical mechanisms include approved travel plans, event management plans, parking management plans, maximum spectator numbers, monitoring requirements and trigger points for further action. We usually advise making those triggers precise. Vague commitments rarely reassure authorities.

    The strongest applications explain not just what is proposed, but why it is proportionate. A concise transport assessment for developments: style framework can help, but sports sites still need bespoke event-day detail.

    And one truth worth stating plainly: mitigation is easier to defend when it is designed into the scheme early, not added hurriedly after highways comments land.

    Common Evidence, Surveys, And Data Needed To Support An Application

    A robust sports grounds transport assessment lives or dies on evidence quality. Assumptions are unavoidable, but they should be traceable and tested. In most cases, supporting data will include classified traffic counts, turning counts at key junctions, parking surveys, pedestrian and cycle counts, public transport timetables and service frequency information.

    For existing or replacement venues, historic attendance records, ticket scans, fixture schedules and club travel surveys can be extremely valuable. Comparable site data is also useful, provided the comparator is genuinely comparable in location, level of competition, mode share context and access constraints. A town-centre stadium next to a rail hub is not a clean proxy for a semi-rural sports complex.

    Parking evidence deserves particular care. Authorities often want both on-site capacity analysis and local on-street survey work at representative times. If overspill is a concern, weekday daytime counts alone will not do the job.

    We also recommend clear plans and summary tables. Decision-makers rarely object because too much information was presented clearly: they object because critical assumptions were buried. This is where a disciplined traffic impact assessment developers: approach helps, especially when multiple datasets need to support one planning narrative.

    Where seasonality is important, survey timing should be explained. Data collected in school holidays, off-season weeks or abnormal weather conditions may need adjustment or cautious interpretation.

    How To Prepare A Robust Sports Grounds Transport Assessment

    The best way to prepare a robust sports grounds transport assessment is to treat it as an integrated planning exercise from day one. We should agree the scope early with the local highway authority, define realistic scenarios, and make sure the design team, operator and planning advisers are all working from the same assumptions.

    First, describe the venue properly. Not in marketing language, but in operational terms: capacities, pitch use, event types, opening hours, staffing, servicing, gate arrangements and likely attendance profiles. Second, establish a clear baseline using surveys and local network evidence. Third, build transparent scenarios that distinguish everyday use from event conditions and identify a credible worst case.

    From there, the assessment should connect trip generation, parking, access design, highway modelling, active travel routes, public transport and crowd management into one coherent narrative. If one part relies on another, say so. For example, if junction performance depends on a stewarded one-way circulation system, that needs to be explicit and enforceable.

    Presentation matters too. Clear figures, legible plans and summary tables make a real difference in planning. So does honesty. If there is uncertainty, explain it and test sensitivity rather than hiding it.

    For applicants working to tight programmes, the advantage of experienced support is speed without guesswork. With over 30 years of sector experience, our approach at ML Traffic is built around concise, accurate reporting tailored to local authority thresholds and real planning contexts.

    A successful TA does not try to prove that a sports venue creates no impact. It proves that impacts are understood, mitigated and acceptable in planning terms.

    Well-prepared, a Sports Grounds Transport Assessment gives planners and councils the confidence to say yes for the right reasons.

    Frequently Asked Questions About Sports Grounds Transport Assessment

    What is a Sports Grounds Transport Assessment and why is it important?

    A Sports Grounds Transport Assessment is a planning document that examines how people and vehicles access a sports venue, addressing both typical use and peak event conditions. It ensures transport impacts are understood and managed, helping planning authorities make informed decisions.

    When is a transport assessment typically required for sports ground planning applications?

    A transport assessment is needed when a sports facility is likely to generate significant attendance, alter access arrangements, affect junction capacity, or cause on-street parking issues, especially during peak traffic periods or events that require traffic management.

    How do sports grounds differ from standard development sites in terms of transport impact?

    Unlike standard sites with predictable daily traffic, sports grounds experience highly peaked demand around event start and finish, strong seasonal and multi-use activity variations, and unique travel patterns including high walking, coach, and rail use, requiring scenario-based assessments.
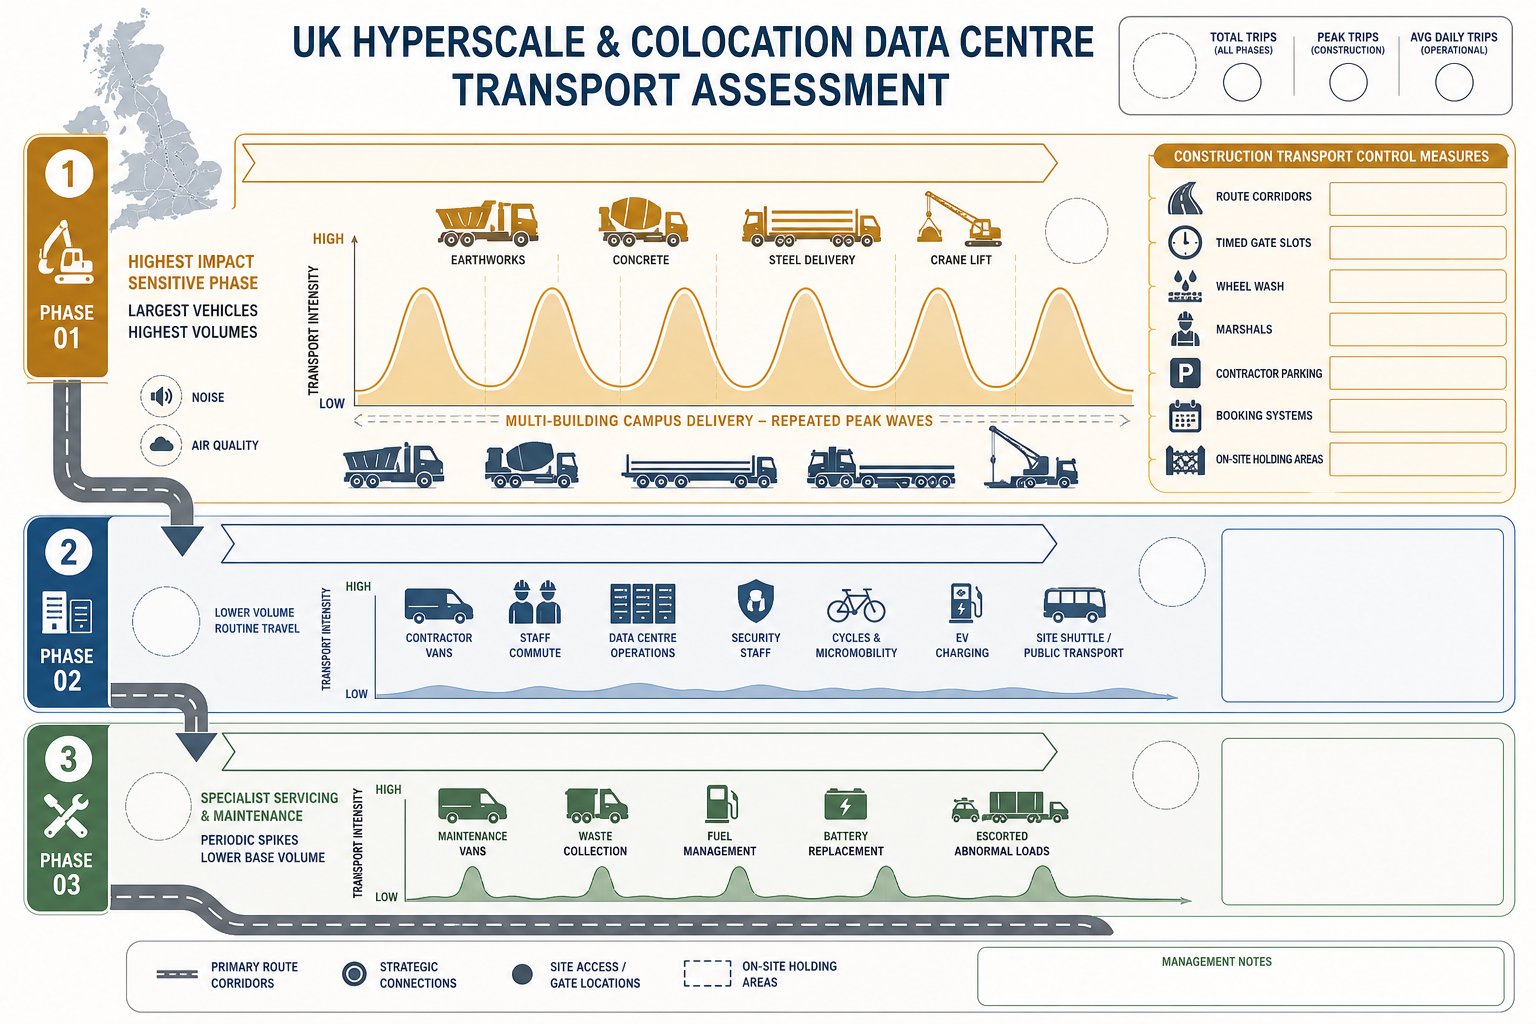
    What key factors are considered in trip generation and attendance analysis for sports grounds?

    Trip generation analyses attendance bands such as baseline use, small, medium, and large events, distinguishing person trips by mode of travel. It considers historic data, ticketing records, mode share, and separates staff, spectators, officials, and servicing traffic for accurate modelling.

    How are crowd management and safety addressed in a Sports Grounds Transport Assessment?

    Crowd management plans within a Transport Assessment include ingress and egress routes, queue storage, stewarding, segregation, emergency access, and temporary traffic controls. These plans ensure pedestrian safety and operational efficiency during high-peak event times.
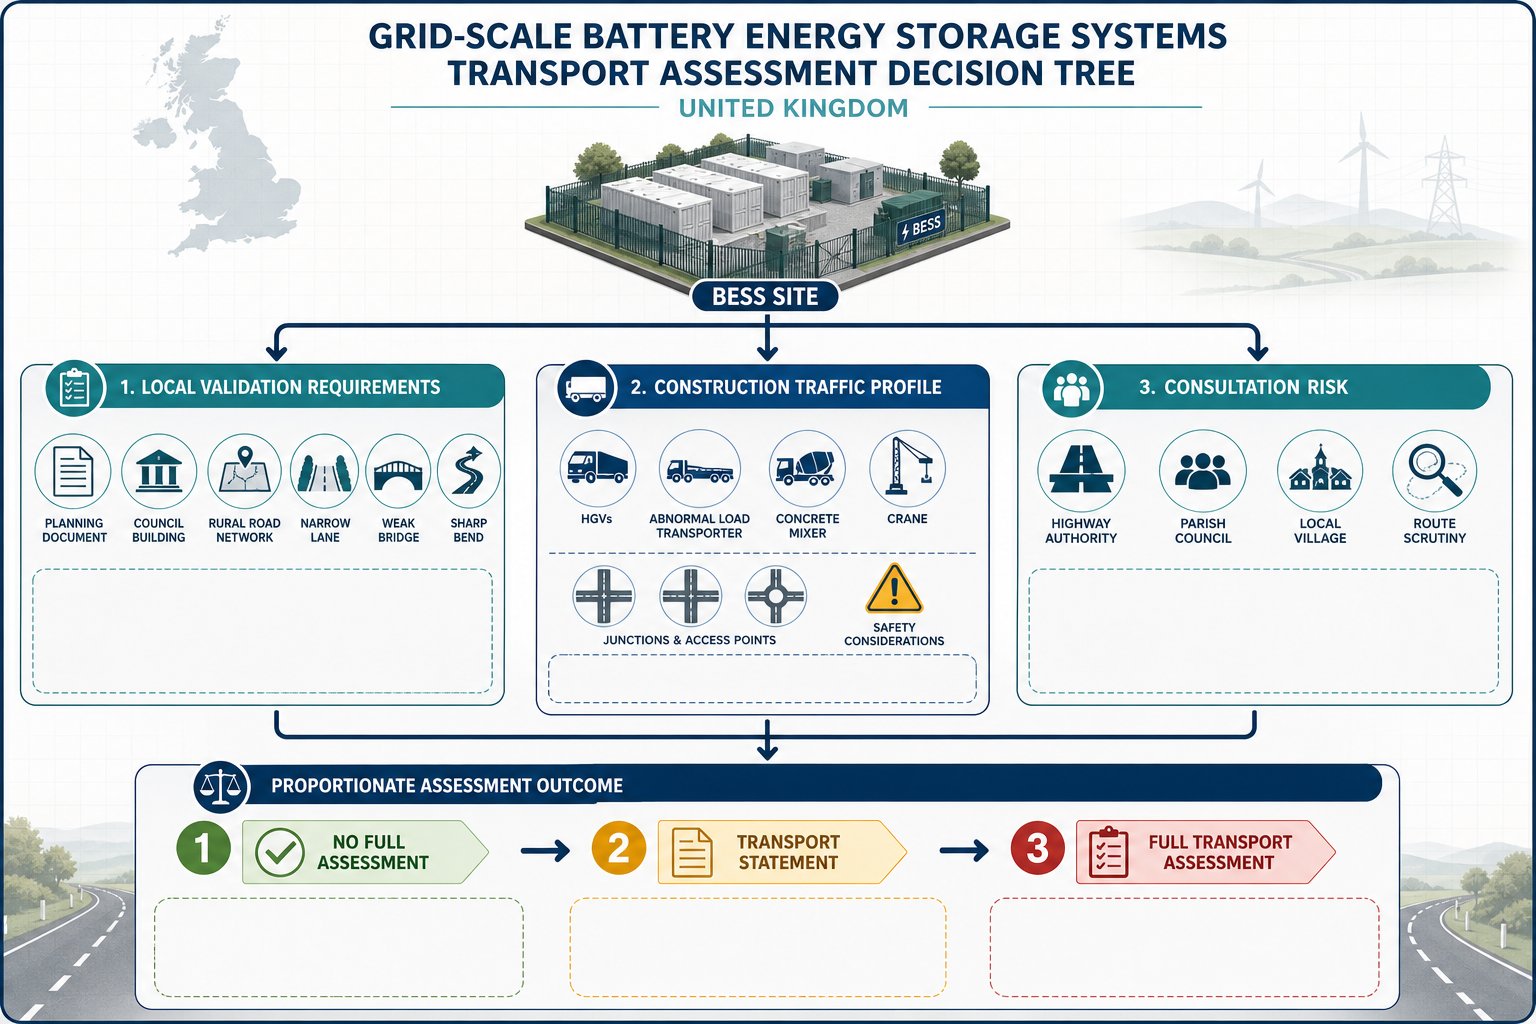
    What mitigation measures are typically included to manage transport impacts at sports grounds?

    Mitigation often involves event-day travel plans, parking controls, shuttle services, pedestrian and cycling improvements, junction upgrades, and enforcement through planning conditions. Early integration of these measures ensures residual impacts remain acceptable to authorities.